Archives for category: PE10
Photo by Vincent M.A. Janssen on Pexels.com

Way back in January 2016, I wrote this post.

In it I added some more recent bear markets to the table that I had previously gotten from somewhere and updated it to try and crystal ball-gaze as to whether to things would be better or worse and this is basically what I said then:

2015/2016 – Oil, China, Commodities rout / 3539.95 (high in Apr ’15). Given today’s close of 2559.75, we have had a total of a  -27.7% drop over a total of 280 days.If we’re lucky, we’ll just have another 10% more of declines to go; If not, we’re looking at another 30%.

This bear has obviously felt more painful than the last one, especially so because things didn’t look very expensive from a PE10 point of view so I’ve been very early in suggesting that it’s not a bad time to get invested.

Oh, and how long more will the pain last? History suggests anywhere from 0-360 days. Either way, hang on for the ride!

I was pretty prescient as the post was dated 20 Jan 2016 while the market bottomed the very next day on 21 Jan 2016.

Unfortunately, of course, I was expecting the dour mood in the market to last anywhere from 0-360 days which meant that I only slowly bought into the market and by the time 2017 came around, I wasn’t fully invested and I felt that the market had run up too far.

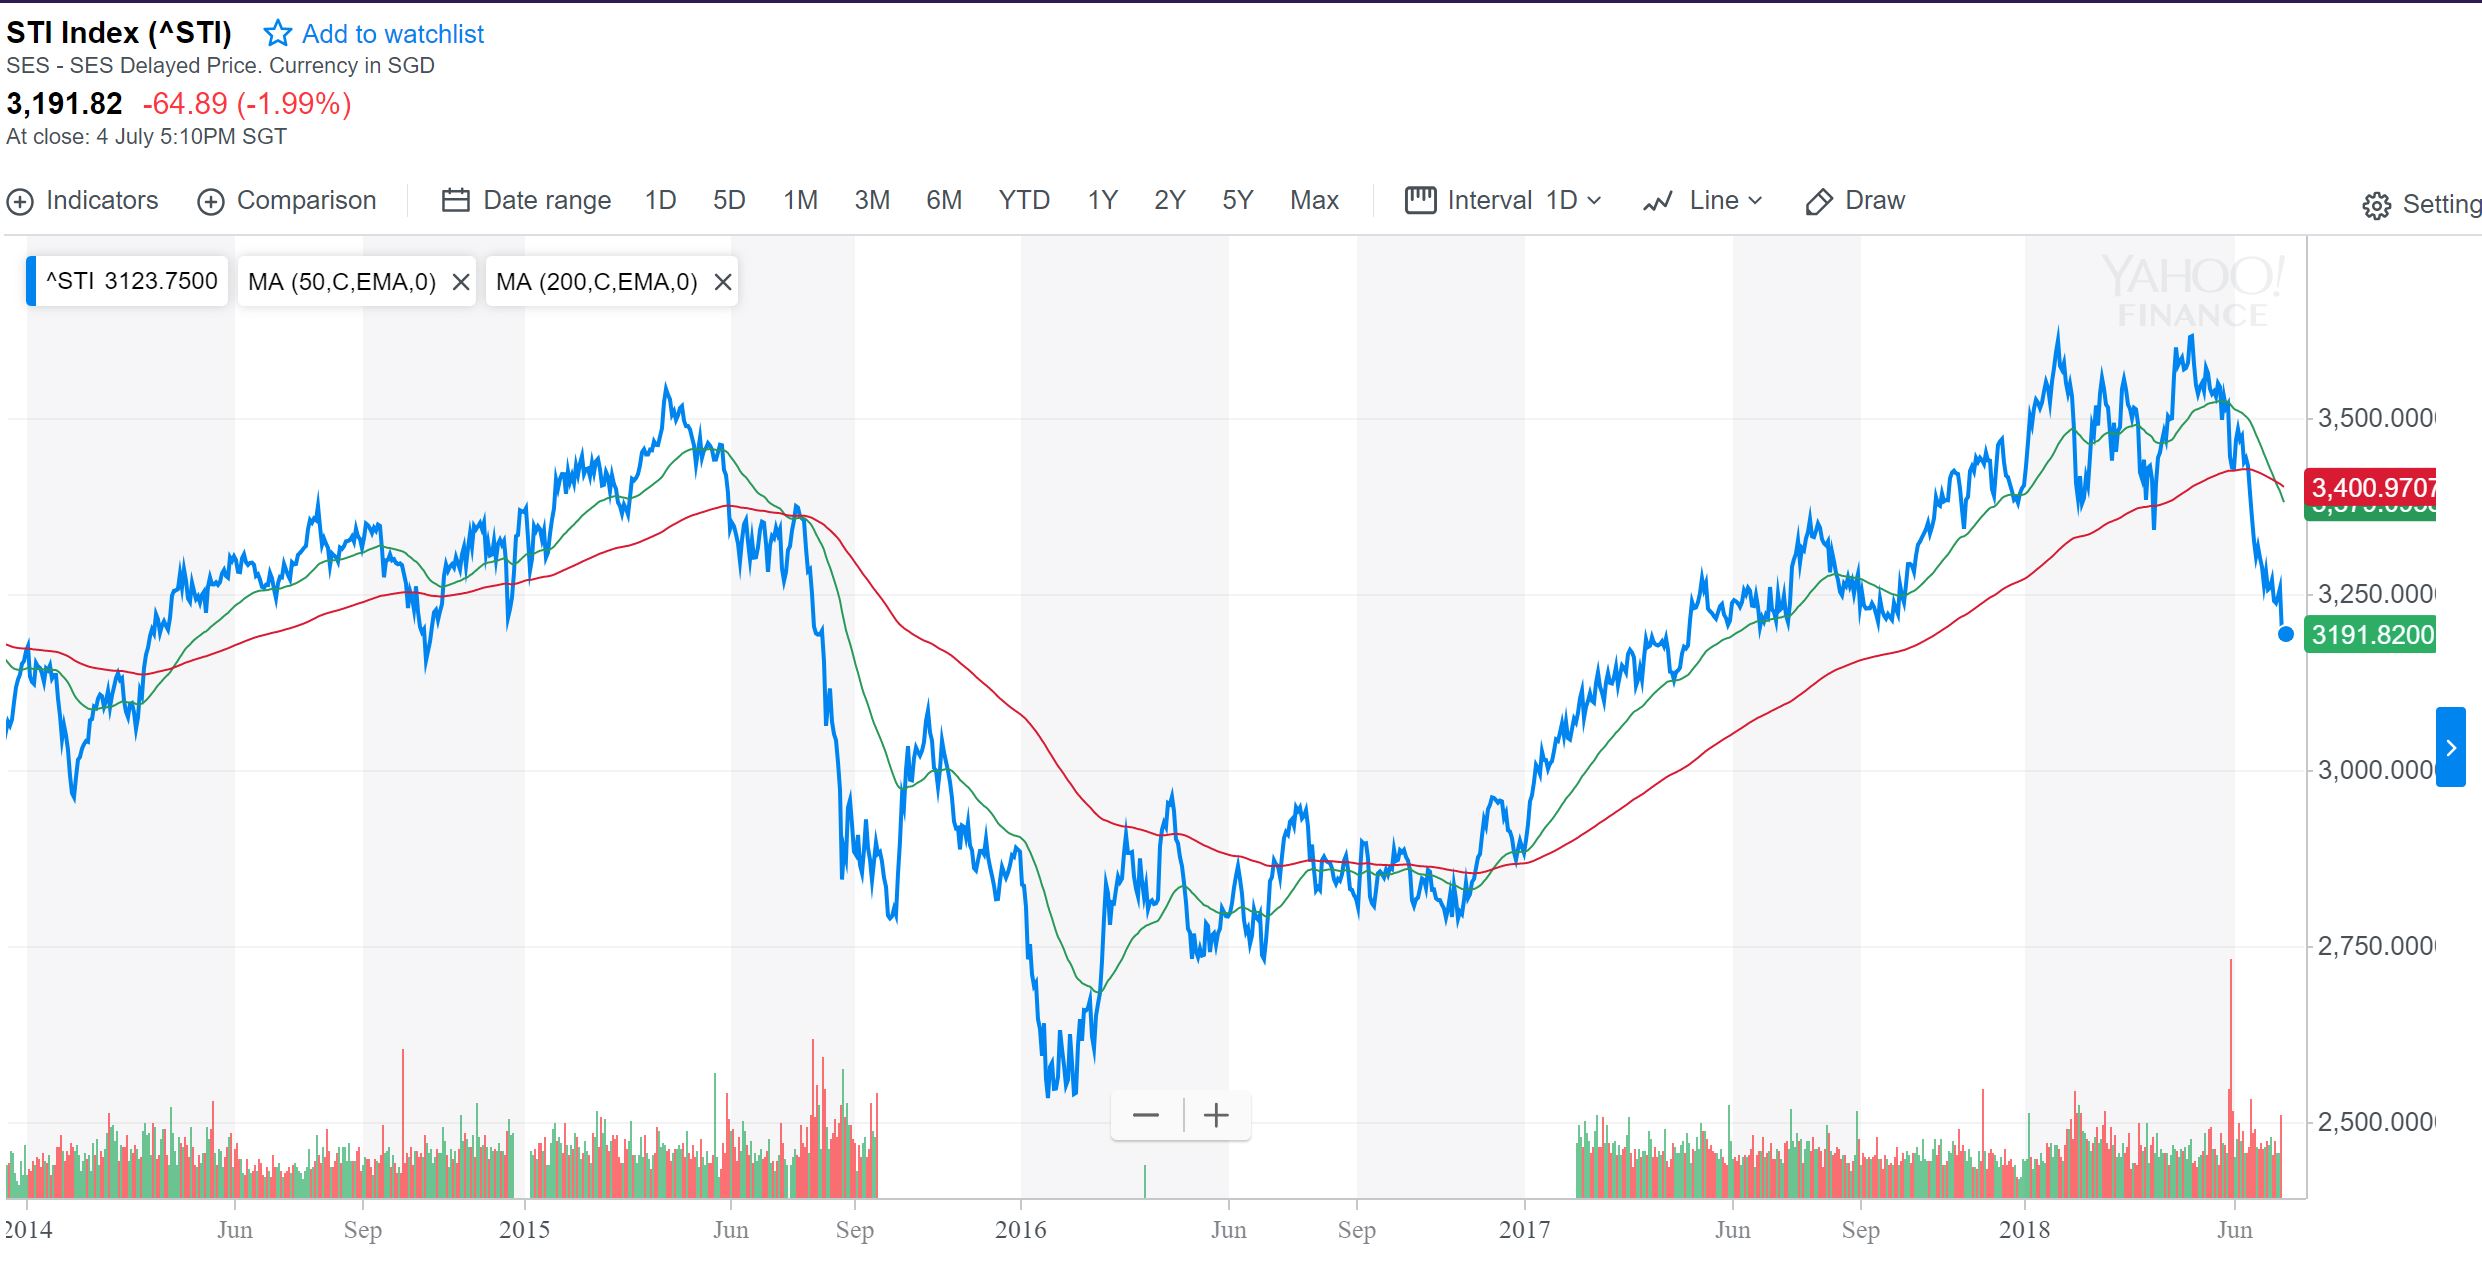
The markets eventually topped out at close to 3,600 in June 2018 and never got back to that level. You could also argue that the more recent high is the 3,400 or so level made in mid-2019 but whichever level you pick, I think it’s right to say that we are way off those highs right now.

What’s next?

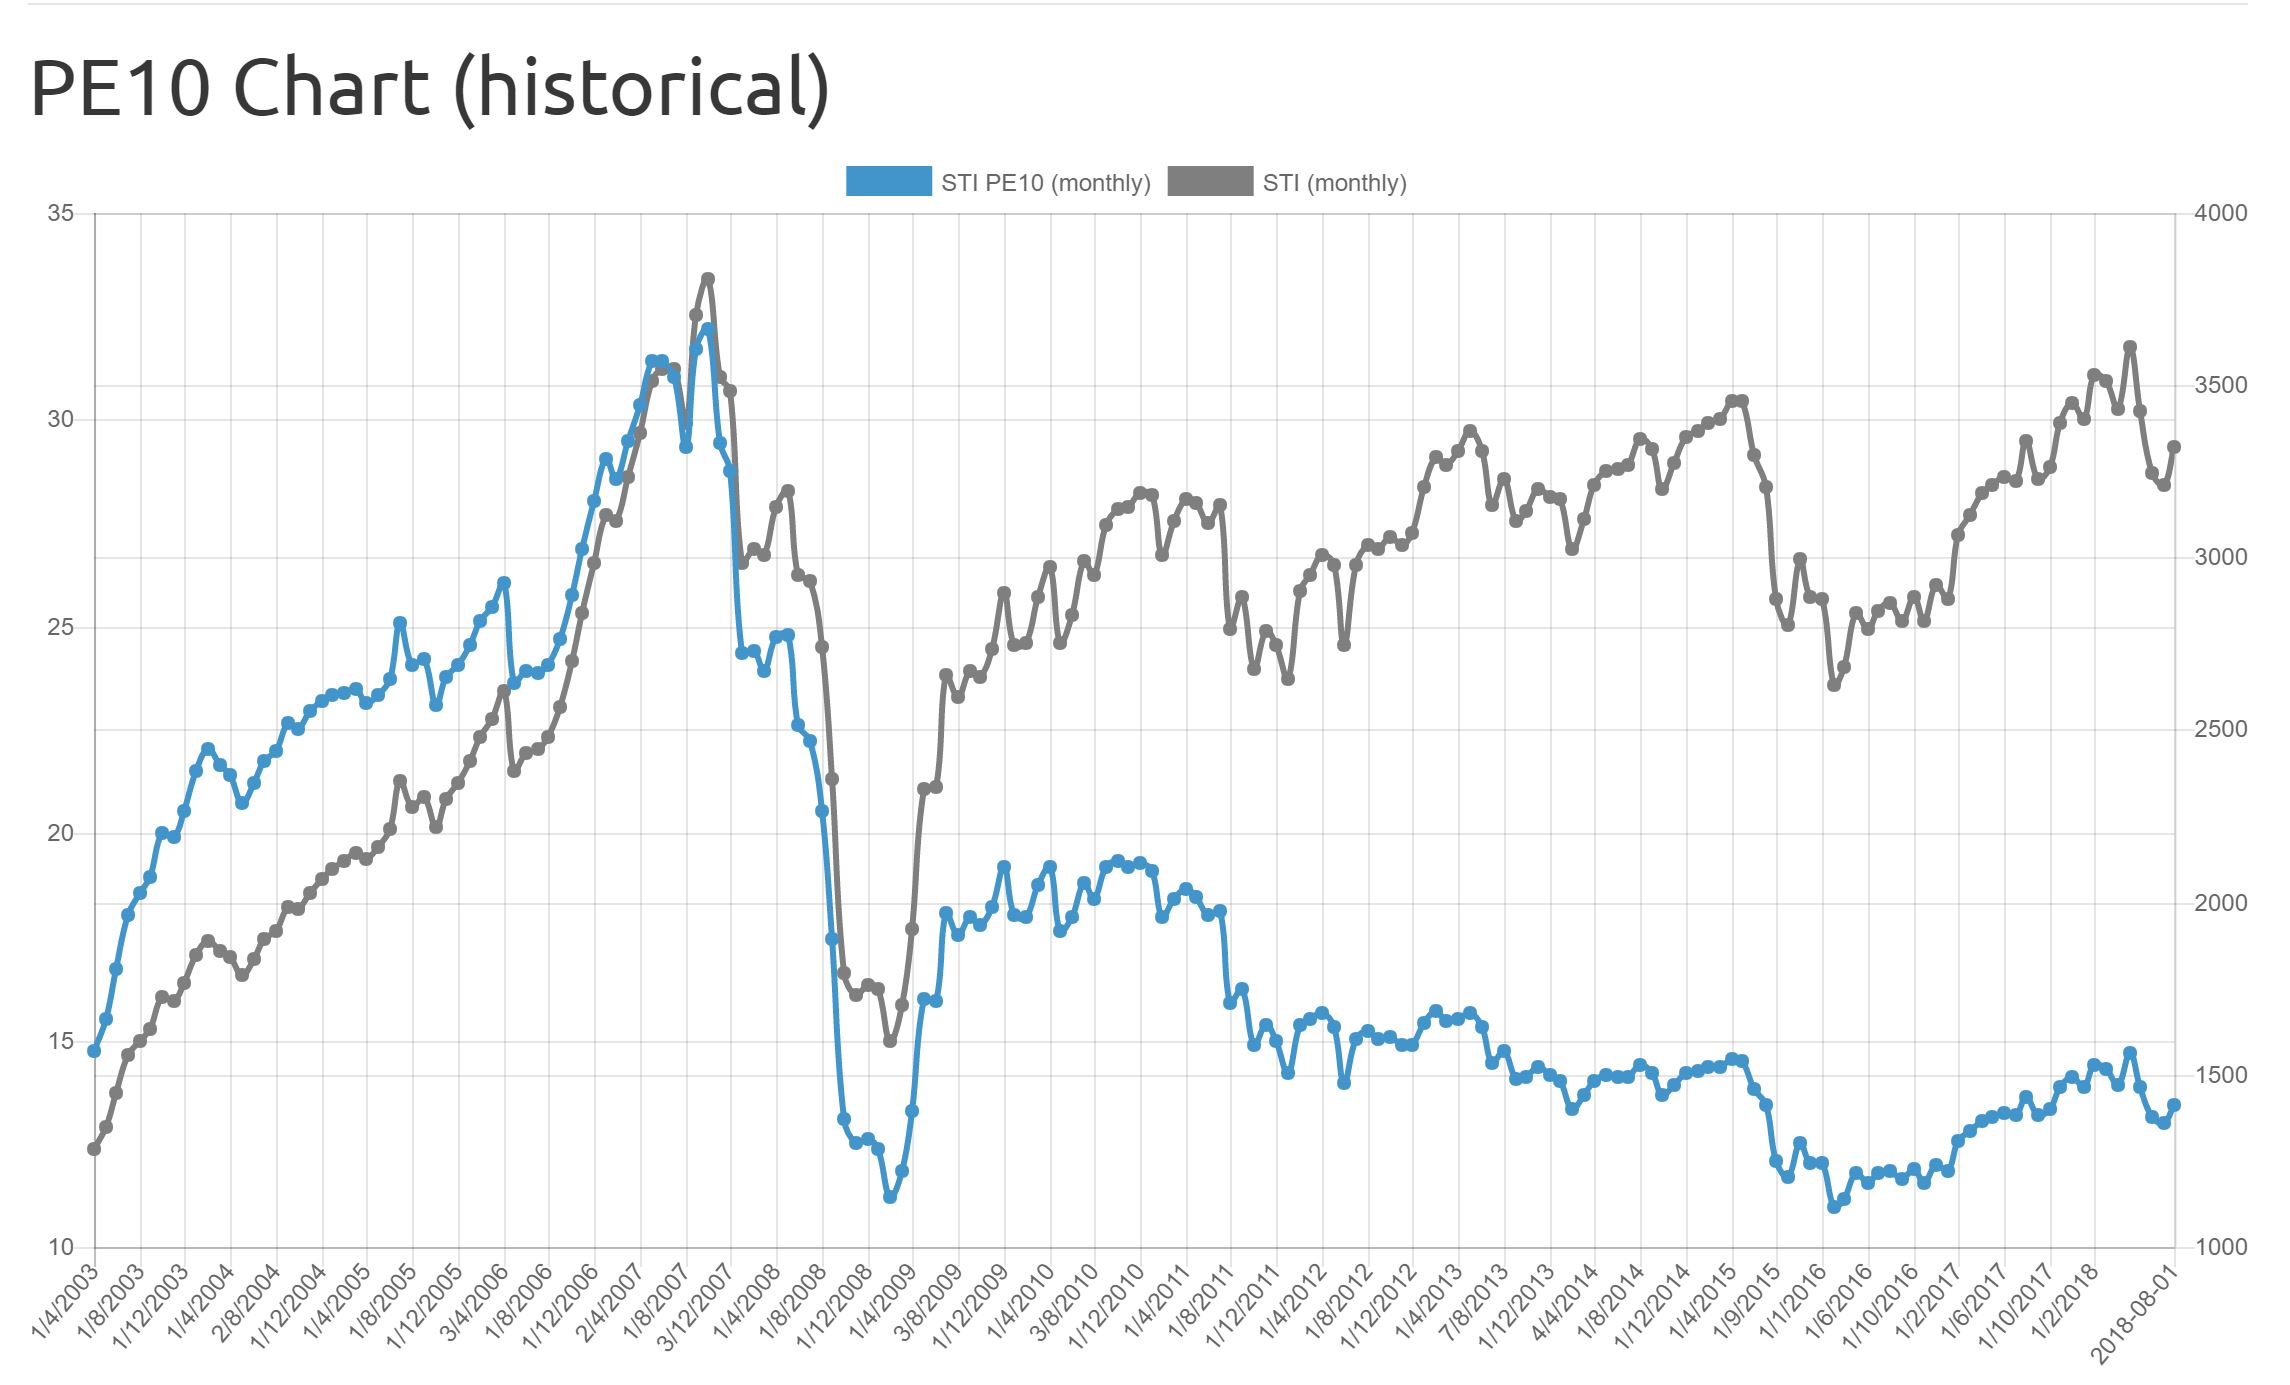
Those that have been following my blog for some time will know that I’ve been tracking the PE10 for the STI for a long time now and based on the PE10 measure, the STI in recent years has traded anywhere from 10.95x in Jan 2016 to 14.67x in May 2018.

Of course, the PE10 was lower than 10.95x towards the end of Jan 2016 but it’s close enough to give us a sense of how cheap things are and how cheap things could get.

I haven’t updated the PE10 since it isn’t the beginning of the month but the 10 year average earnings are currently about 260 which means that the current PE10 is just slightly over 10x earnings.

This is really the cheapest it has been for the data I have. Once again, the PE10 isn’t perfect and the data I have doesn’t track it perfectly but it gives us a good sense of the environment we’re in.

Could it get worse?

This is where some bear market history could be instructive.

Start dateEnd dateIndex startIndex end% changePeriod (days)EventSingapore Recession?
03/04/198515/4/1986690456.35-34%407US RecessionYes
08/11/198712/07/19871288.13595.77-54%118Black MondayNo
16/7/199010/11/19901304.49855.63-34%87US RecessionNo
17/2/199709/04/19982129.81805.04-62%564Asian Financial CrisisYes
01/03/200021/9/20012582.941241.29-52%627Dot-comYes
19/3/200203/10/20031808.411213.82-33%356SARSYes
10/11/200703/09/20093875.771456.95-62%663GFCYes
11/11/201010/05/20113293.392528.71-23%180Euro-debtNo
16/4/201521/1/20163531.612532.7-28%281O&G blowoutNo
Singapore Bear Market History (updated until 2016)

So, if history is to be our guide, we need to ask ourselves which history looks similar to our situation? Is this more like 2016 or more like 2008?

If it’s 2015-16

If things are more like ’15-16, then expect the markets to drop at least another 10-15% from here and for the pain to last for another 5-6 months. I suppose the narrative in this case would be that no other bad news hits the markets and that the current narratives see the light at the end of the tunnel.

If it’s 2008-2009

First off, notice I didn’t say 2007. 2007 was the official top in the market, after which the market began a gradual slide amidst rumblings of trouble for financial institutions.

Then the panic hit in 2008 with the collapse of Lehman Brothers (September 2008) which followed the fall of Bear Stearns (March 2008). However, markets didn’t bottom until some 6 months later in March of 2009.

The difference between September 2008 and now is that markets had already fallen by some 50% from their levels in March 2008. Right now, markets have only fallen some 20+% which barely puts us in a bear market.

This scenario would probably play out if we start to see some sort of widespread credit event filter into the market as a result of the COVID-19 and OPEC+ situation.

Crystal-balling

Therefore, considering all scenarios. If I had to make a very, very rough guess, I would say that we should look for a bottom at around 1800-2200.

However, relative to even the GFC, valuations for the STI would be ridiculously cheap at those levels. Unfortunately, U.S markets aren’t cheap and that is driving a lot of market activity nowadays.

The thing that the market has going for it right now that is that markets have fallen so much in such a short period of time which almost makes it certain that we should see markets rebound hard in the coming weeks. In fact, the rebound might have already begun last Friday.

Regardless, watch the markets closely over the next 6-9 months. Chances like this don’t come around that often and don’t try to bottom fish because no matter how smart you are, you will probably never catch the market at the bottom.

tl;dr

The chance to get into markets at cheap valuations have come once again. It isn’t anywhere near as cheap as 2016 or 2009 yet but I’m sure we’ll get there.

However, things are probably only just getting started and will likely play out over the next 6-9 months.

Photo by Pixabay on Pexels.com

Given the increased volatility in markets, I thought I’d share some thoughts on the current state of the market. Note that this isn’t a forecast nor does it constitute advice to buy or sell any securities.

Positives

The STI’s PE10 (data here) is 12.2x which is pretty much the same as it’s PE (12.21x). That translates to an earnings yield above 8% which in my opinion, is pretty attractive.

If you’re wondering how this stacks up the past, the PE10 isn’t dirt-cheap. It was cheaper during the depths of the GFC in early 2009 and also once more in early 2016. However, it is cheaper than it was in 2013- early 2015 and cheaper than during the run up to the GFC in 2006-2007.

Also, 10-year bond yield have fallen really low. The SGS 10-year bond yield is currently 1.735% which means that spreads between the STI and 10-year bond have reached 6.46% which is some of the highest spreads I’ve seen since I’ve started tracking the STI PE10 vs. the SGS 10-year bond yield.

Negatives

From a psychological/technical standpoint, markets are not down in the dumps. The 50-day SMA is still above the 200-day SMA and prices have not fallen all that much (only roughly 14% from its May 2018 peak and 9% from its late April 2019 peak). Also, with the August close, the monthly STI has now closed below the 10 period MA which is Meb Faber’s momentum signal to get out of the market.

Plus, let’s not forget that the Trade War isn’t going anytime soon even though, as of late August, it seems like Xi and Trump are trying to kiss and make up.

Trump faces re-election next year and if he’s playing to win, then it’s likely he’ll find some foreign powers to blame for America’s real or perceived woes. And we know that his go-to guys to blame for America’s woes are those that have huge trade surpluses with the U.S., namely, Mexico and China.

Also, a no-deal Brexit is also looming in October and with Boris Johnson in charge, it’s less likely there will be any sort of deal that can be reached and will tensions between Japan and Korea get worse? And who knows how the situation in Hong Kong will turn out?

Only time will tell.

Overall

I’m near-term negative but long-term positive because geopolitics and economic sentiment is bad but valuations are starting to look attractive. Of course, if you’re a DCA sort of person, then all of the above shouldn’t matter to you.

Sorry for the late notice but the PE10 has been updated.

airport bank board business

Photo by Pixabay on Pexels.com


Following the selloff in the last week of October, the PE10 reached lows that we haven’t seen since early 2017. At a PE10 of 12.2x, that translates into a 10-year earnings yield of slightly over 8%.

It’s cheap but it certainly isn’t dirt cheap. Dirt cheap would be when the PE10 is hovering around 10x average 10-year earnings. That would mean that the STI would be at levels of around 2500 or so.

Having said that, there’s no guarantee that the STI will fall to those levels. The market has run up a bit since I took the reading so who knows where we’re headed. What I’m confident enough to say is: based on what we’re seeing in the market, we’re certainly close to cheap than expensive.

Updated one day late! (check the stats out here)
But still representative of the overall picture of the markets.

Markets have climbed a little in the last week of September. I’m lucky that I stuck to my plan and committed some capital to the STI ETF a couple weeks back.

Anyway, Q3 is over and we’re heading into Q4. Sentiments are kinda pessimistic around the world with all the trade spats going on but markets don’t seem to care that much.


airport bank board business

LOL. I didn’t mean to choose a pic of such an exotic exchange.


We’re heading deep into the 3rd quarter of the year. The STI’s been largely directionless while U.S. markets have continued to hit new highs. Nothing surprising here as markets outside of the U.S have been weak since the start of the year. It also reminds me of a post by Ben Carlson on how U.S. markets and World Markets don’t exactly have a one-to-one correlation. In fact, the correlation can sometimes be negative. A good reminder of why we need to be diversified beyond our home markets.

Having said that, it does mean that other markets are cheap relative to the U.S. If that’s the case, then where should you put your money?

I think the answer’s fairly obvious.

Check out the PE10 stats here.

pexels-photo-164527.jpeg

Photo by Pixabay on Pexels.com


I’ve written about this before but here are what I consider the latest signs that we’re in the later stages, rather than the beginning to mid-stages, of the credit & business cycle. First, here’s Josh Brown’s take on it (emphasis mine):

I’ve never seen a seller’s market quite like the one we’re in now for privately held companies. In almost any industry, especially if it’s white collar, professional services and has a recurring revenue stream. There are thirty buyers for every business and they’re paying record-breaking multiples. There are opportunities to sell and stay on to manage, or sell to cash out (and bro down). There are rollups rolling up all the things that can be rolled up.

He goes on to explain why private equity (PE) firms, flooded with cash, can’t sit still and chill out. Do go over to the link and read the whole thing.

Reading the Signs

But also consider the following:

Those are anecdotal but all of the above can only happen if markets are rising and credit is loose. These conditions also mean that investors have to be optimistic about the kind of returns that they get.

When there’s more money chasing available assets, it bids the price of these assets up and the only way that the assets can provide the same return is if the asset’s earnings power increases. This is typically a strategy based on hope and optimism. Conversely, the best time to buy is at the depths of the market when pessimism is everywhere because that strategy is based on things getting less bad which is much more realistic.

What Conservative People are Doing

Another good cue is to see what more conservative investors do. Unknown to many investors, Warren Buffett wrote long-term equity-indexed put options from 2004-2008 and these options have started to expire, and Berkshire Hathaway has also unwound some of their other derivative exposures. Now, while Buffett constantly exhorts that it’s futile to time the market, he’s no stranger to letting cash build up when he cannot find good deals.

This is the crucial difference that many people do not understand. What Warren Buffett means is that he cannot predict whether the markets will go up or down on a certain date and time but what he does is judge whether a deal presented to him is likely to provide a satisfactory rate of return. Whether the rate of return is likely to be satisfactory depends greatly on valuations, which in turn depends greatly on the state of credit and optimism in the markets.

If Buffett is letting cash build up, what do you think he thinks about current valuations in the market?

What does it say about the Singapore Markets?

Of course, valuations in the U.S. markets may be high but what about Singapore? After all, the local market has been beaten down pretty badly since the start of the year. Many local investors are probably also feeling the pain because of how badly seemingly conservative stocks like SPH and Singpost have been beaten down by the market.

Also, if you check out the Cyclically-Adjusted Price-to-Earnings (CAPE or PE10) ratio of the STI, it is currently under the historical average and median which means that for long-term investors, the STI is not necessarily expensive. However, if U.S. markets drop, remember that local markets will not be immune to negative sentiments.


Let me know your thoughts on the markets in the comments below.

Following a reader’s comments on the STI PE10 data, I’ve decided to make it available for download. If you go to the site, you’ll now notice that I’ve added a “Download Data” button in the ‘Background’ section.

dwnloadData.JPG

Have fun with the PE10 data. It’s something I’ve compiled every month for the last 5-6 (?) years.

There are five pieces of data in the file:

(1) the STI close,
(2) the PE  ratio,
(3) the date,
(4) the implied earnings, and
(5) the average 10-year earnings.

(1), (2) and (3) are self-explanatory. You may find some discrepancies with actual data as there were certain months that I failed to update the data in time and therefore had to extrapolate the data, or I updated a day or two later than I was supposed to. However, for all intents and purposes, it should reflect the PE10 fairly accurately.

(4) and (5) are calculated based on (1) and (2). In order to get an average of the past 10 years’ earnings, I need the current earnings. This is where the “implied earnings” is easily calculated by taking (2) divided by (1). With (4), you can then calculate (5). The PE10 which is not in the file is then simply (1) divided by (5).

Some people may prefer to use an exponential moving average of 10-year earnings or you want to adjust earnings for inflation like Shiller does. Feel free to use the data as long as it’s not for commercial purposes.

If you find anything wrong with it, feel free to let me know.


In case you haven’t heard about it, I have an STI PE10 site that will track the STI PE10 and generate some simple statistics.

And I’ve updated it! It now displays a chart showing the STI’s PE10 versus its closing price all the way back till 2003.

stiPE10chart

Here’s what you’ll see on the site. Generated the chart using chart.js

STIpe10ScreenCap

It’s not much but I’m proud to say that it works and I made it from scratch (with a lot of dependencies and googling)


Finally, I got down to creating a page for the Straits Times Index’s PE10. Right now, it’s very simple. it just displays the latest month’s PE10 as well as the historical average and median values.

I’ve picked up coding for some years now but my progress was and still is, slow. However, it looks like I learned enough python and javascript to create a page where I can share the STI’s PE10. The page will be updated monthly.

What I did is really hacky because:

  1. I have to manually key in the STI closing price and PE.
  2. Run a python script locally to process the latest entry, calculate the PE10 and output to a json file.
  3. Upload the json file to the server for the page to retrieve the data, do some calculations for the average & median, and display it.

At some point, I hope to add a chart to the page so you can track how the PE10 has changed over the years and the subsequent capital gains based on a certain year’s PE10 ratio.

You can check out the page here or from the list of resources on my blog.

If you have any tips on how I can improve the page, please let me know in the comments below.

STIjul18.JPG

Markets have been hit. Are you worried?


So, in February I wrote this:

I’m not out of the markets because I believe timing it is a futile exercise but I moved more money to cash/bonds as valuations got higher. In fact, I stopped buying anything after Feb last year.

This week, no thanks to the government increasing the Additional Buyer Stamp Duty (ABSD) on the sale of property, the markets fell roughly 2% on Friday alone. The STI is now down some 268 points or roughly 8% from the start of the year. From the highs of 3,577 reached in April, the market is now down 11.7% which puts us firmly in correction territory.

As mentioned in my February post, I stopped buying into the markets since February of 2017 as things were getting expensive and I basically enjoyed the ride up. I also started trimming some positions towards the end of 2017 as markets climbed. Selling UMS at what was nearly the peak for it netted some accounts a nice profit.

In case, you’re thinking that I made out nicely, I haven’t.

A couple of stupid decisions, like not selling Venture at its peak (I actually placed the order to sell it at $28 but it didn’t get filled) and not selling Starhub at all (this could be one for the history books) meant that my portfolio has been hammered somewhat. Not knowing when to sell has been one of my weak points and still continues to haunt me.

However, what I’m much better at is knowing when to buy. Thankfully, I’m (relatively) young and therefore being a net buyer is still the right way to go. By all the measures that I’m tracking (e.g. CAPE for the STI, difference between PE10 yields and the 10 year government bond, and some trend indicators), it appears that a buying opportunity is starting to appear.

A word of caution. Things are NOT dirt cheap based on valuations. We have seen cheaper valuations in late ’08-09 as well as ’16-early ’17. What many people don’t realise is that the market was much cheaper in early ’17 compared to mid ’10-’11 despite them being roughly at the same levels. This is because earnings had risen from 2011 to 2017 while prices barely rose.

This is the mistake that my senior colleague made. He was anchored on the price of the market and therefore, a level of 3,000 looked expensive to him in early 2017. This caused him to basically miss out on the upswing in markets in 2017.

If you think things are going to be as bad as they were in 2009, then based on current normalised earnings, the STI should bottom out somewhere around the 2,700 level. Expecting the STI to hit 1,500 as it did in the depths of the Global Financial Crisis is expecting the market to be hit CAPEs of 6x! That’s probably even lower than levels during the Asian Financial Crisis.


What do you all think? Let me know in the comments below.