
It’s not much but I’m proud to say that it works and I made it from scratch (with a lot of dependencies and googling)
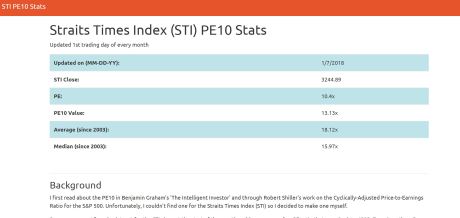
Finally, I got down to creating a page for the Straits Times Index’s PE10. Right now, it’s very simple. it just displays the latest month’s PE10 as well as the historical average and median values.
I’ve picked up coding for some years now but my progress was and still is, slow. However, it looks like I learned enough python and javascript to create a page where I can share the STI’s PE10. The page will be updated monthly.
What I did is really hacky because:
- I have to manually key in the STI closing price and PE.
- Run a python script locally to process the latest entry, calculate the PE10 and output to a json file.
- Upload the json file to the server for the page to retrieve the data, do some calculations for the average & median, and display it.
At some point, I hope to add a chart to the page so you can track how the PE10 has changed over the years and the subsequent capital gains based on a certain year’s PE10 ratio.
You can check out the page here or from the list of resources on my blog.
If you have any tips on how I can improve the page, please let me know in the comments below.

[…] case you haven’t heard about it, I have an STI PE10 site that will track the STI PE10 and generate some simple […]