Sorry for the lack of posts but I’ve been busy at work. Will be busy until early June. Anyway, markets have been rangebound and unexciting.

Photo by Mikes Photos on Pexels.com

Dividends matter, growing dividends matters more
(Klement on Investing)

Not really an interesting finding but I thought the finding is important because it confirms that from a behavioural investing point of view, there is some merit to those who believe in dividend investing.

Klement reports that a study by Paul Schultz finds that most investors don’t sell down their stocks to fund their expenses and therefore dividend-paying companies tend to see less turnover in their stock (i.e. more loyal shareholders).

I’m saying this because there was some debate on this following a post by Kyith of Investment Moats. I think the topic was relatively hot here in Singapore because many of the Singapore-listed stocks tend to be dividend payers rather than the more growth-y companies you find in the US markets.

Is the 60/40 Portfolio Still Relevant?
(Enterprising Investor)

The CFA blog runs some data on various portfolios (including the 60/40) across a few different markets. The tl;dr and caveats are:

Based on the lumpsum Sharpe ratios, the 100% equity portfolio had the best risk-adjusted performance through 2022 in all markets save Italy. For the period ending 31 December 2021, the 60/40 allocation fared best on a risk-adjusted basis in each country but not globally. The 80/20 allocation did better than 100% equity and 100% bond allocations in some markets and worse in others. Overall, the bond disaster of 2022 dragged down annualized and risk-adjusted returns.

To draw further conclusions about the utility of the 60/40 portfolio versus the 80/20 or any other allocation strategy requires further research. Indeed, our colleagues are in the midst of conducting it. But as our analysis shows, a portfolio redeemed at year-end 2021 would have outperformed the same portfolio redeemed at year-end 2022. This is a good reminder of the risk of end-point bias in any time series analysis.

To be sure, our investigation has limitations beyond those mentioned above. It does not account for the impact of foreign currency conversions, exclusively focuses on developed markets, and has an abbreviated investing period. Nevertheless, it does provide a window into how different asset allocation strategies played out over the past decade and illustrates how the 60/40 portfolio can add to risk-adjusted returns and how outlier years can drag down performance.

Is Britain Finally Ready To Admit Brexit Was a (Catastrophic) Mistake?
(Eand.co)

Who would have guessed? -_-“

Ok, everyone with half a mind was saying that it’s a bad thing. Also, I had a look at JPM’s Guide to the Markets for 2Q23 and guess which Developed Economy is still struggling with a close to 10% inflation rate?

BudgetMealGoWhere: New website lets you find cheap eats from S$3 at nearby HDB coffeeshops
(Vulcan Post)

The list of places in my ‘hood is sad. =(

The Greatest Wealth Transfer in History Is Here, With Familiar (Rich) Winners
(The New York Times)

It’s not just in New York. I’ve been telling friends that we’re about to see something similar in Singapore.

QQQ

Photo by Mikes Photos on Pexels.com

Money Can’t Buy Happiness…Or Can It?
(Of Dollars and Data)

I’ll be the first to admit that I was one of those who bought into Kahneman and Deaton’s finding that earning more than $75,000 per year doesn’t make one much happier.

And of course, I think it was earlier this year or late last year when mainstream media was publishing headlines about the new study that found that happiness actually rises with income all the way to levels up to $500,000 or something to that effect.

So what gives? I’m glad Nick Magiulli breaks down the latest study by Kahneman and Killingsworth (author of the study which had findings opposite of Kahneman’s) which aims to resolve the difference between the two studies.

So it turns out that Kahneman and Deaton’s study was measuring unhappiness and this latest study also finds that more money only makes happy people more happy while it does nothing for unhappy people.

Ultimately, happiness comes from within.

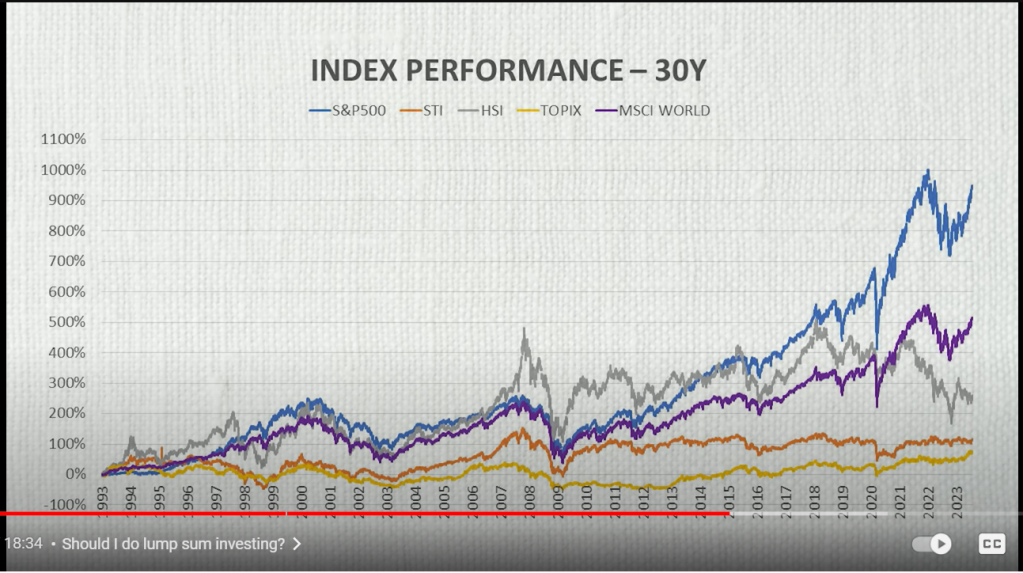
The Singapore Terrible Index and the Glorious S&P 500 Index
(Investment Moats)

I’m not going to comment on the snarky tone that Investment Moats has taken on of late.

Let me state the positives. I agree with Kyith that Mr. Loo of 1MDB fame has been giving bad advice when it comes to investing in Singapore equities. As pointed out by Kyith, even if the STI’s performance has been bad, the STI isn’t the only game in town.

I also agree that the assessment made that Mr. Loo’s criticism of the STI is not exactly accurate because, in his YouTube videos, I’ve never heard him cite returns that account for returns in a common currency. The S&P which Mr. Loo prefers is denominated in USD while investing in the STI or Singapore equities is denominated in SGD. So if you want to be honest, you need to account for the impact of FX rates on returns.

Mr. Loo is a brilliant marketer and promoter but he is certainly no investment guru. If anything, I find him becoming more and more like a Singaporean version of Robert Kiyosaki. He could be right on his market calls but he may not be right for the right reasons.

Ok, that aside, let me point out the parts of Kyith’s post that I have problems with.

First, Kyith uses the returns from a fixed time period (1970 to Apr 2023) to make his point that investing in Singapore equities has been pretty ok. I suppose he did that because that’s the entire history of the returns available. The problem I have is that taking an arbitrary starting point like 1970 is just a bad analysis because that is cherry-picking a starting point that could be biased towards/against the calculated returns. I wouldn’t have an issue if he had presented rolling returns (maybe 1, 3, or 5 years) for comparison.

Second, I’m not sure why he bothered to compare investing in Singapore small-caps with the S&P500. You’re basically taking on very different risk-return profiles here.

Third, this point is particularly important because I’ve seen many other financial bloggers make this mistake. If you want to compare returns, you should use investable returns. I’m not sure how investable the S&P500 and MSCI Singapore indexes were in the 1970s but even in more recent times, I’m pretty sure that investing the S&P500 through an ETF or index fund that tracks it is going to be lower cost and has less friction than a fund that tracks the MSCI Singapore Index. This is going to make a big impact on the returns an investor is likely to achieve. Similarly, this is why I wouldn’t have brought up the Singapore small-cap index because those many of the names on the index are likely to see the kinds of returns promised by the index once you actually account for bid-ask spreads and other friction that come with those less liquid names.

Yeah, so that’s all I have to say on the matter. I hope that what I’ve shared comes across as constructive criticism and if anyone gets offended by what I have to say, then I can only say that this wasn’t my intention.

Additional Buyer’s Stamp Duty (ABSD): How Much You Have To Pay To Own Multiple Properties & 5 Ways To Avoid ABSD
(Dollars and Sense)

The recent move by the government is definitely targeted at the hot money moving in Singapore’s property sector.

It seems to me that the private property market in Singapore is a whole different ballgame now. It’s all about making returns rather than for the utility of staying in the property.

On one hand, you have the Singaporean/PR who believes that property investment is a surefire way to get wealthy.

On the other, you have foreign buyers looking to move wealth out of their home country and I guess one of the easiest ways to move wealth and ensure that the wealth gets preserved is to move into real estate (Singapore is by no means unique in this regard).

It’s no wonder that I see many former students only in their 20s choosing to become property agents. After all, if one deal nets you as much income as your peers earn in a whole year, then what’s the point of getting a deskbound, 9-5 job?

Given the dynamics, I’m not sure I want to be a private property buyer in this market. You’ll need the continued flow of hot money in order to make money from property investment and we know how fast sentiment can change.

A quarter of the year is gone. May the other three-quarters be good for you.

Photo by Mikes Photos on Pexels.com

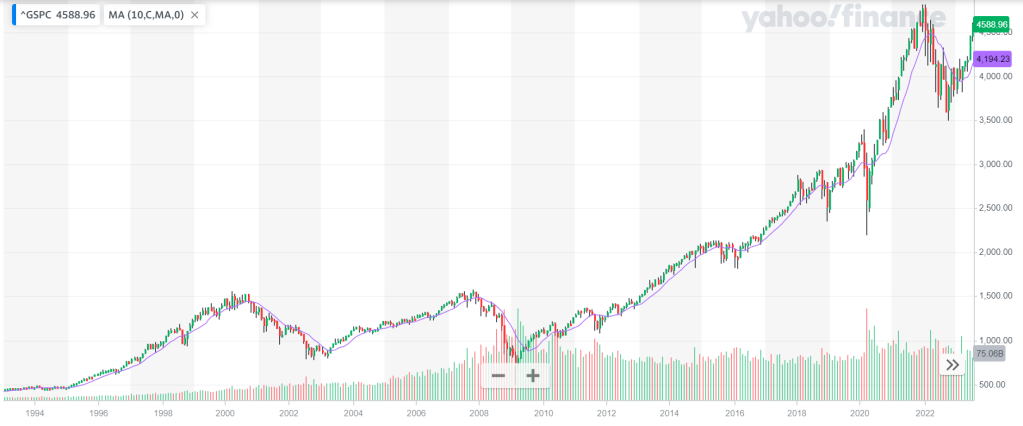
What Beat the S&P 500 Over the Past Three Decades? Doing Nothing
(Morningstar)

Let your winners run.

MAS proposes stricter standards for prospecting, marketing financial products
(The Business Times)

(The article is hidden behind a paywall)

From the gist of the article, it seems that MAS wants to propose stricter standards on how financial products are advertised. While the article refrained from explicitly identifying the kinds of businesses that currently do this, it seems that the measures are aimed at the sort of people that market financial products at roadshows or the sort that advertise products with high returns on social media without further details on the type of product or the risks involved.

The Problem With Being House Rich
(A Wealth of Common Sense)

While the post is about US homeowners, the same applies to Singaporeans. Maybe even more so given the high rate of home ownership in Singapore.

The 15HWW Permanent Portfolio Update: April 2023
(15HWW)

For those looking to emulate Mr. 15HWW, I suggest taking the following into consideration before going further.

  1. The portfolio hasn’t exactly been permanent since crypto was in the original formulation of the portfolio. Remove crypto and reevaluate the performance for a better gauge of the portfolio’s performance.
  2. Benchmark the portfolio against something that has actual risk-premia rather than the CPF SA which is essentially a risk-free long bond. This is only fair as CPF is a government-backed scheme while equities, bonds (if they aren’t government securities), and crypto obviously have a risk-premium baked in.
  3. His “permanent” portfolio carries FX risk. This isn’t an argument for or against the dollar. Once again, just pointing out that investing in Berkshire, Gold, and Crypto all carry FX risk relative to the SGD.
  4. I’m not sure why there’s been a rule change from “rebalancing” to “no rebalancing” but this essentially means that this portfolio will eventually be STI/Berkshire/Crypto-heavy. This is given the assumption that equities and crypto have a higher expected rate of return than cash/bonds/gold. I’m not saying it’s a bad thing (see first link above) but just something to be aware of.
  5. You don’t measure volatility based on drawdown. But that’s also why this portfolio can’t be benchmarked against the CPF SA (vol = 0, drawdown = 0). Just saying.

I’m not saying that this portfolio is bad or it shouldn’t be implemented. I’m not about to tell someone how to invest their money. I’m just saying that I disagree with many of the points made in the post and if you want to get an accurate sense of the actual risks or how to measure those risks present in the portfolio, then you need to consider the above points.

All in all, the permanent portfolio isn’t so permanent after all.

This week was a tough week at work. I’ve come to realise that I have zero aptitude and desire for some of the tasks required of me. More than that, I realise that at my age and stage in life, what I really want is a break and the space to pursue my interests. The last thing I need are deadlines for tasks that bore me.

The countdown has begun.

Photo by Mikes Photos on Pexels.com

Trickle me, Elmo
(Klement on Investing)

Next time anyone mentions “trickle-down economics”, please show them this.

Is the 60/40 Portfolio Still Relevant?
(Enterprising Investor)

Not sure if the post had a conclusion but the money shot from the piece is (emphasis mine):

To draw further conclusions about the utility of the 60/40 portfolio versus the 80/20 or any other allocation strategy requires further research. Indeed, our colleagues are in the midst of conducting it. But as our analysis shows, a portfolio redeemed at year-end 2021 would have outperformed the same portfolio redeemed at year-end 2022. This is a good reminder of the risk of end-point bias in any time series analysis.

With any rate of return figures, it helps to remember that choosing a single time period to demonstrate returns is a sign of poor research.

What Makes You Happy
(Collaborative Fund)

There’s wisdom to this piece that I understand but struggle to practice in everyday life. May you reach there sooner than me.

For some reason, the hot economic topic of the week is about the USD losing its relevance in the near future. I’ve lost count of the number of local Finfluencers on YouTube that made videos about the topic in the same week. I’m not quite sure what the trigger for this is but I guess it may have something to do with the Saudis talking about switching to accepting RMB as payments for oil.

The funny thing is most of these local guys on YouTube don’t know much about international economics and basically parrot whatever they’ve read from Bloomberg or the WSJ. I’ve heard their commentary and I’ve not heard one of them mention current account surpluses/deficits, capital controls, or the amount of trade done in USD. This is International Econ 101 which pretty much determines the likely future path of a country’s FX rate.

Remember, it’s already hard enough for geopolitical analysts, macro-, and international economists to get this right. So if you hear some Singaporean YouTuber whose usual spiel is to recommend credit cards or their armchair analysis on Tesla start talking about whether the RMB will replace the Dollar, please don’t hit “Like and Subscribe”.

Photo by Mikes Photos on Pexels.com

30 under 30-year sentences: why so many of Forbes’ young heroes face jail
(The Guardian)

The short answer is because they are young, dumb, and full of c*m.

The longer answer is that we now live in a world hyper-fixated on quick fixes and instant success. Think of all the people flaunting their success on Instagram or Tik-Tok. Even if it took them a couple of years, it’s all condensed into a 15-second reel because no one has time to even sit through a clip that’s a minute long.

And that’s going on the premise that a successful business or product can be built in a year or two. To my knowledge, that’s a lousy premise.

Oh, and it’s also telling that the list is from Forbes. That goes to show what sort of media outlet they are – one that focuses on fads and headline-grabbing personalities rather than actual business.

Weekend reading: Making a K Drama out of the FIRE movement
(Monevator)

Adding this purely for the commentary on the link between a certain K-drama and the FIRE movement. I resonate with this because if investing doesn’t lead to freedom to do whatever you want, then what the hell are you doing it for?

Sadly Giving Up On Retirement And Going Back To Work
(Financial Samurai)

Not quite what the headlines suggest.

1Q23 has come and gone and what a quarter it’s been. Markets started off the year strong, riding the momentum that started towards the end of last year with China’s reopening. Then, the fallout from a run on SVB seemed like it would cause a wider banking crisis with Credit Suisse becoming a casualty of the fallout. Fortunately, things seem to have calmed down somewhat although many people are speculating that the next shoe to drop will come from the weakness in Commercial Real Estate.

Whatever happens, may the odds be in your favour.

Photo by Mikes Photos on Pexels.com

How to Build Generational Wealth [All You Need to Know]
(Of Dollars and Data)

Nick Magiulli provides a great overview and breaks down the steps needed to build generational wealth. Based on my own reading and observation, he’s got the points mostly right. I would add that the crucial step is to ringfence the wealth from the members of future generations that are likely to squander the wealth – that is, even if the growth rate of future generations grows faster than the growth rate of the family wealth, the family wealth can be protected if the less productive members get a minimal or inconsequential share of the wealth. Personally, I wouldn’t pass down any substantial amount of money or control to anyone in the family if they haven’t reached a certain age e.g. 40 years old because by then, enough time would have passed to determine if they have the character capable of handling that amount of responsibility.

An Unconventional Guide to Happiness
(Mark Manson)

Ok, Mark Manson can really write.

Accounting-Fraud Indicator Signals Coming Economic Trouble
(WSJ)

Uh-oh.

On a more serious note, it’s a common narrative that when economic conditions become more challenging, companies start getting more creative with their accounting in order to meet quarterly expectations. I don’t believe the incentives for this sort of behaviour have changed.

WHAT HAMILTON TAUGHT ME ABOUT BUILDING A STRONG BRAND
(Cheerful.egg)

Lionel is also a very good writer. The view on strategy by Roger Martin cited in the post is a very enlightening.

A boost to productivity growth from AI?
(Klement on Investing)

Time for white-collar workers to embrace the inevitable.
John Maynard Keynes’ vision of the future is here.

Following the downfall of Credit Suisse, markets seem to be fearing a contagion among European banks. Deutsche Bank seems to be the poster boy for this new wave of contagion and I think news in the coming week will be all about whether the ECB manages to contain this wave of negative sentiment or whether we’ll see another wave in this banking crisis.

Early in the year, I was in the camp that the hike in interest rates could cause instability in some markets but I never thought that it would be in the banking sector given how much more capitalised banks are following the GFC. I honestly thought it would be in commercial real estate (especially the office segment) because of how work-from-home has become a fixture of post-covid life. If the banking sector is already reeling from this recent turmoil and the commercial real estate sector takes a hit, things could get ugly.

Having said all this, the next few years could be one of the rare times where DCA-ing into the market will outperform lump-sum investing. If you’re a young investor getting started today, you couldn’t pick a better time.

Photo by Mikes Photos on Pexels.com

‘Gerbil banking’ preceded the Great Depression. We’re seeing it again today
(Fortune)

Was this the genesis of the Post Office offering banking services? I’ve always wondered why Japan’s Postal service had such a huge banking arm and why we have Post Office Savings Bank (POSB) in Singapore. Maybe this origin story in the US explains it.

Strategic thinking matters
(Klement on Investing)

The game described in the article is one that I’ve read about before. In fact, they used the very same setup in one of the games in season 2 of Alice in Borderland on Netflix. Maybe it’s a good filter when hiring traders.

Why your financial conditions index sucks
(FT.com)

The money shot from the post is:

In any case, because a financial conditions index has no natural unit, it can’t really be compared over long periods – as Catherine Mann points out, there’s no absolute answer to whether conditions are “loose” or “tight”, just a sense that if the line is going up they’re getting tighter and if they’re going down they’re getting looser. This means that the FCI, however cleverly constructed, isn’t giving more information than you could get by looking at a chart of share prices (with maybe a fleeting glance at a chart of bond spreads). 

Aha, maybe it’s time to throw some of these things away.

Where People Find Meaning in Life: revised in 4 slides
(r/dataisbeautiful)

Someone posted a visualisation of a survey on areas in life that people in different countries find meanginful. I found this interesting for a few reasons:

  1. Family, Children, and Community relations rank near the top across all nationalities. This seems to echo the finding from The Good Life which is a book based on a long-running study of what matters in life to people.
  2. The results for Singapore (see 2nd picture in the link) are arguably quite different from every other country in the survey in that even in the top-ranked category “Family and Children”, only 29% of those surveyed answered positively on whether they found meaning in life from this category.

In short, maybe whatever studies you read about that survey predominantly White Anglo-Saxon People (WASPs) don’t really apply to this part of the world after all.

The fallout in banking has gone international! Credit Suisse was in the headlines this week after they couldn’t secure capital from their biggest shareholder – the Saudi National Bank due to regulatory requirements. Ultimately the Swiss central bank had to step in but it seems that move was a temporary band-aid. Will CS be merged with UBS or taken over by some other bank? Who knows?

Meanwhile, I’ve been catching up on all the news and opinions regarding the financial sector fallout and it seems to me that this was a combination of regulatory failure, bad risk management on the part of both SVB and its depositors, and the byproduct of the current macro environment.

The worry now is that credit will be tighter for longer and be another source of headwind for the already weak global economy. The good thing is that the recent drop in markets and less-than-rosy- sentiment means that it could be a good time to start getting back into markets if you had cash waiting on the side.

The main problem with that is valuations for US markets aren’t necessarily cheap.

Photo by Mikes Photos on Pexels.com

Don’t Chase the Past
(bilello.blog)

Great post. Goes at odds with the momentum crowd though.

The economist who won the Nobel for his work on bank runs breaks down SVB’s collapse—and his fears over what’s next
(Yahoo finance)

I forgot that Diamond and Dybig won the Nobel Prize in Economics for their model on Bank Runs. Anyway, great points made by Diamond in this Fortune.com article that’s posted on Yahoo finance.

What I Think About the Silicon Valley Bank Situation
(Ray Dalio)

Ray Dalio thinks SVB is just the start of things to come.

Myth-Busting: The Economy Drives the Stock Market
(Enterprising Investor)

The economy is undoubtedly linked to the stock market. The question is which way is the casuality and how much does it matter?

“But even if economies and stock markets are highly correlated, it does not necessarily follow that high-growth countries make for good investments. The low volatility factor demonstrates that low-risk stocks outperform their high-risk counterparts, at least on a risk-adjusted basis, and the excess returns from growth stocks are essentially zero. The same likely applies on a country-by-country basis.”

You can use the stock market to predict the economy but you can’t necessarily use the economy to predict the stock market.

What a week!

On Tuesday, Fed chair Jerome Powell spoke and in an instant, changed the markets’ view on the direction and magnitude of interest rates. Then Silvergate Bank, a bank that provided services for the crypto industry, got shut down on Wednesday. And yesterday, Silicon Valley Bank, a bank that catered to startups and the VC crowd announced it was also getting liquidated.

It’s already common knowledge that the low-interest rate environment of the last decade fueled an excess in the startup, crypto, and tech space. If there was any excess in the system, that was where the excesses were and therefore, it’s no surprise that the tech space has borne the brunt of the reversal that came because of higher interest rates.

What we’re seeing now (tech layoffs, demise of those who extended credit to the sector) seems to be Act 2 or beginning parts of Act 3 of that bubble bursting. I don’t think we’ve seen the end of this story yet because many of those who benefited from the bubble are still around (think ARK Invest, Tesla, and Masayoshi Son).

Having said that, if you’re investing for the long-term, valuations are definitely a lot more compelling now than in January. Even more so if your reference point are the all-time highs of early 2022.

Photo by Mikes Photos on Pexels.com

The Fed is Breaking Things (and it could get worse)
(The Big Picture)

SVB
(The Reformed Broker)

Two-fer that gets you up to speed with the news and commentary surrounding the demise of Silicon Valley Bank. I’ve seen less-than-informed mainstream media outlets in Singapore suggesting that this is another ‘Lehman moment’ and that the next GFC is around the corner. Honestly, they don’t know what they’re talking about.

Most stock pickers underperformed in 2022’s ‘stock picker’s market’
(Tker.co)

S&P Dow Jones Indices published their annual SPIVA U.S scorecard. Even in a year like 2022, picking an active manager to beat the S&P500 fared worse than a coin-toss. I’ve looked through the report (link here) and the base case for picking an active manager that can beat their benchmark is awful (Report 1a and 6a for US and International Funds respectively).

It Turns Out Money Does Buy Happiness, At Least Up to $500,000
(Bloomberg)

So much for the often-quoted figure of $75,000. By the way, that figure is for salary and not net worth. So it appears that most of us in the rat race are there for a reason.

The Basics of FIRE
(Early Retirement Now)

Big ERN provides a very succint overview of the various components and quick math to FIRE.

HOW TO ACTUALLY BE DATA-DRIVEN
(cheerful.egg)

A wonderful and well-written piece on how to actually do data-driven decision-making. Reminded me so much of how we used to do the opposite at my former job that I sent this to a former colleague. We agreed that so much of the time wasted in meetings was due to the fact that many of the meetings didn’t focus on the data. If anything, it was driven by personalities, anecdotes, and opinions.

Photo by Murilo Botelho on Pexels.com

Following my previous posts on retirement (here and here), I’ve been thinking about how to measure how far along one is on the Financial Independence ladder. Measuring your financial fitness is also useful to gauge which areas you need to improve on. While I’m sure that this is as much an art as it is a science, it’s helpful to be able to quantify some of these measures or have some sort of benchmark to compare against.

Many others have already attempted to answer this question and I have drawn inspiration from the works of many other people who have tried to answer this question. If there are any errors in my interpretation of their work, I apologise in advance.

Some ways to measure your financial fitness

Kyith from Investment Moats has this post on what he calls the “11 stages of wealth”. It’s a linear way of measuring one’s financial fitness and I think the nice thing about this is that it’s easier for most people to think in linear terms. I’m not sure I completely agree with this way of representing things because it’s not so clear that some levels come before others. For example, level 6 states that “wealth is 10 years worth of current annual expenses” while level 7 is “wealth’s annual cash flow is greater than annual basic survival expenses”.

I’m not sure why level 7 is after level 6 and to me, one seems like a stock measure while the other is a flow measure. For non-finance people, you may think of this as one metric measuring how much water is there in a storage tank while the other measures how much water flows out of the water tank. The two measures are related but they mean very different things. For example, you could have a lot of water in the tank but if the outflow is greater than any inflows, then it’s likely you’ll run out of water sooner or later.

The point I’m trying to make is not that one metric is better than the other but rather that both metrics measure different things and I’m not certain that one must come before the other.

Seedly has a set of 8 personal finance metrics which I like. They range from measuring solvency to the proportion of non-housing assets to net worth. I’ve adapted some of these and added levels against which you can measure your progress. This is very raw but I think it’s something worth exploring and refining.

More importantly, I hope it’ll be useful in helping people figure out how far along they are in terms of financial independence or it could also be used as a measure of financial fitness (i.e. which areas of your personal finances are you stronger or weaker in)

Measuring financial fitness

Here are some metrics I think are useful and the various levels to assess one’s fitness.

LevelsSavings rate
(with CPF)
(%)
Savings rate
(w/o CPF)
(%)
Debt servicing ratioDebt to equity
(%)
Months of emergency cashNet worthLiquid assets
(% of net worth)
Income from assets
(% of current expenses)
1< mandated CPF contribution rates< 0%Unable to repay periodic payments>100Nil<0NilNil
2= mandated CPF contribution rates= 0Able to only make min. repayments to rollover debt=100< 300-150-30
3< mandated CPF contribution rates + 10%1-10Able to repay debt repayments<=60< 6>=$100K16-30>30
4< mandated CPF contribution rates + 20%20-30Monthly income > 5x monthly debt repayments<=40< 10>=$1M31-45>50
5< mandated CPF contribution rates + 30%>30Monthly income > 10x monthly debt repayments<=20> 12>=$5M>45>100
Source: Author’s own

Let me describe each measure, how it’s calculated, and why it matters.

Savings rate (with CPF) – this measures the total amount saved either through CPF or net monthly pay. While many people in Singapore use their CPF OA to pay for their monthly mortgage, this metric gives a more comprehensive picture of a person’s true savings rate since it is not true that ALL Singaporeans will use their CPF OA money for housing.

Savings rates (w/o CPF) – this measures the savings rate based on net monthly income. It indicates one’s willingness and/or ability to forgo current consumption and is a good indicator of how soon a person can reach financial independence. This is especially so since there is a cap on CPF contributions above a certain income. From the earlier piece on retirement, it appears that a savings rate of 10% is typical across the developed world, hence I’ve let 10% be the middle ground (i.e. Level 3).

Debt servicing ratio – this is a cashflow measure that determines whether one is on the road to financial ruin. After all, if one’s income is unable to (fully) service their debt, then interest on the debt will accumulate and you will either need to sell assets to raise cash or find other sources of credit to draw from.

Debt to equity – provides an indication of one’s ability to take on and service debt. In this case, equity for a person is equivalent to his/her net worth. It’s an indicator of their ability to pay off their debts. Any number above 100% means that a person is technically insolvent because the equity (assuming it’s sold instantaneously for its current value) is not even able to cover the amount of debt that one has.

Months of emergency cash – An indicator of how much cash a person has to tide through any loss of income. Depending on how conservative you want to be and assuming the typical case where income is more than expenses, you could measure this as months of expenses to cover (less conservative) or months of income to cover (more conservative).

Net worth – everyone’s favourite indicator. More often used in a dick-swinging contest but it gives a person an indication of how wealthy you are and how many goods or services you could theoretically purchase. Obviously, the higher the number, the better. I’ve used $5M as the entry point for the highest level because let’s face it, inflation has and will continue to make being a millionaire less of a deal than it used to be.

Liquid assets – an indicator of true wealth since liquid assets are also assets that are more likely to be liquidated close to their stated value at any point in time. Classification by their broad category can be misleading. For example, equities are generally thought to be liquid assets but some equities can be thinly traded and have large bid-ask spreads, making their net realisable value quite different from the current value. Markets that are liquid may also see their liquidity vanish in certain scenarios. Generally, the higher the better and it’s quite telling that as people get richer, they tend to hold a larger proportion of their net worth in financial assets (liquid) rather than real estate (less liquid).

Income from assets – An indicator of whether you still need that income from work. These include income from fixed-income instruments, dividends from equities, or rental income from real estate. Putting Dividend Irrelevance aside, many retirees and investors spend only their dividends and don’t draw down on the principal. You may argue that this is not optimal but if it works from a behavioural standpoint, then it is what it is. In general, the higher the better as this reduces the need for an income from work.

In short, the above metrics seek to measure a person’s ability to withstand financial hardship in the event of loss of income from work or to meet unexpected expenses. It also looks at whether a person has difficulty repaying debts or risks becoming bankrupt.

Where I stand on financial fitness

Savings rate
(with CPF)
(%)
Savings rate
(w/o CPF)
(%)
Debt servicing ratioDebt to equity
(%)
Months of emergency cashNet worthLiquid assets
(% of net worth)
Income from assets
(% of current expenses)
46%21%4x11%11>=$1M39%13%

As you can see, I’m at level 4 on most measures which is to say that financially, I’m in a comfortable spot. While my debt servicing ratio is at level 3 (it’s probably closer to level 4), I wouldn’t worry too much because my debt-to-equity levels are really low (level 5).

The area that I really need to work on is increasing my income from assets (level 2). This is an indication that a good proportion of my assets are non-income producing (i.e. home equity, non-dividend paying stocks/businesses, or capital gains from past investments).

I’ll be tracking these metrics on a monthly basis to see how they evolve. I don’t expect to see much change from month to month but I guess it’s like monitoring things such as blood pressure to make sure that everything’s going well.

I’m sure there are many ways to improve these metrics. Maybe we could measure net worth excluding primary residence?[1] Are there other metrics to consider? Are the various levels appropriate?

Let me know what you think in the comments below!

Notes:
[1] Although the counter-argument is that for someone who’s considering selling their house to live overseas or to rent out their house and rent overseas, including their primary residence in the calculation gives a more economically-accurate picture of their finances.