Archives for category: Singapore

QQQ

Photo by Mikes Photos on Pexels.com

Money Can’t Buy Happiness…Or Can It?
(Of Dollars and Data)

I’ll be the first to admit that I was one of those who bought into Kahneman and Deaton’s finding that earning more than $75,000 per year doesn’t make one much happier.

And of course, I think it was earlier this year or late last year when mainstream media was publishing headlines about the new study that found that happiness actually rises with income all the way to levels up to $500,000 or something to that effect.

So what gives? I’m glad Nick Magiulli breaks down the latest study by Kahneman and Killingsworth (author of the study which had findings opposite of Kahneman’s) which aims to resolve the difference between the two studies.

So it turns out that Kahneman and Deaton’s study was measuring unhappiness and this latest study also finds that more money only makes happy people more happy while it does nothing for unhappy people.

Ultimately, happiness comes from within.

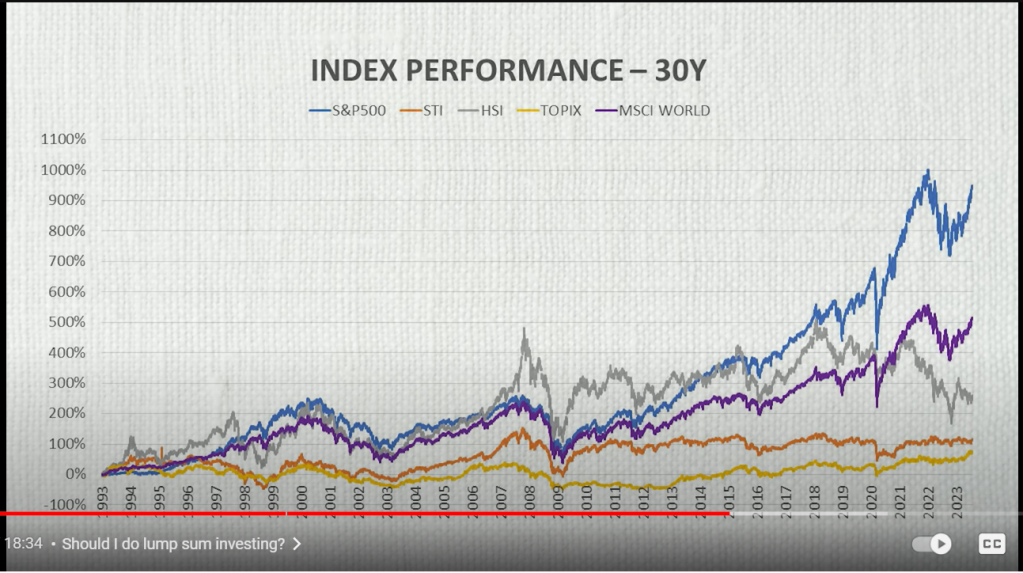
The Singapore Terrible Index and the Glorious S&P 500 Index
(Investment Moats)

I’m not going to comment on the snarky tone that Investment Moats has taken on of late.

Let me state the positives. I agree with Kyith that Mr. Loo of 1MDB fame has been giving bad advice when it comes to investing in Singapore equities. As pointed out by Kyith, even if the STI’s performance has been bad, the STI isn’t the only game in town.

I also agree that the assessment made that Mr. Loo’s criticism of the STI is not exactly accurate because, in his YouTube videos, I’ve never heard him cite returns that account for returns in a common currency. The S&P which Mr. Loo prefers is denominated in USD while investing in the STI or Singapore equities is denominated in SGD. So if you want to be honest, you need to account for the impact of FX rates on returns.

Mr. Loo is a brilliant marketer and promoter but he is certainly no investment guru. If anything, I find him becoming more and more like a Singaporean version of Robert Kiyosaki. He could be right on his market calls but he may not be right for the right reasons.

Ok, that aside, let me point out the parts of Kyith’s post that I have problems with.

First, Kyith uses the returns from a fixed time period (1970 to Apr 2023) to make his point that investing in Singapore equities has been pretty ok. I suppose he did that because that’s the entire history of the returns available. The problem I have is that taking an arbitrary starting point like 1970 is just a bad analysis because that is cherry-picking a starting point that could be biased towards/against the calculated returns. I wouldn’t have an issue if he had presented rolling returns (maybe 1, 3, or 5 years) for comparison.

Second, I’m not sure why he bothered to compare investing in Singapore small-caps with the S&P500. You’re basically taking on very different risk-return profiles here.

Third, this point is particularly important because I’ve seen many other financial bloggers make this mistake. If you want to compare returns, you should use investable returns. I’m not sure how investable the S&P500 and MSCI Singapore indexes were in the 1970s but even in more recent times, I’m pretty sure that investing the S&P500 through an ETF or index fund that tracks it is going to be lower cost and has less friction than a fund that tracks the MSCI Singapore Index. This is going to make a big impact on the returns an investor is likely to achieve. Similarly, this is why I wouldn’t have brought up the Singapore small-cap index because those many of the names on the index are likely to see the kinds of returns promised by the index once you actually account for bid-ask spreads and other friction that come with those less liquid names.

Yeah, so that’s all I have to say on the matter. I hope that what I’ve shared comes across as constructive criticism and if anyone gets offended by what I have to say, then I can only say that this wasn’t my intention.

Additional Buyer’s Stamp Duty (ABSD): How Much You Have To Pay To Own Multiple Properties & 5 Ways To Avoid ABSD
(Dollars and Sense)

The recent move by the government is definitely targeted at the hot money moving in Singapore’s property sector.

It seems to me that the private property market in Singapore is a whole different ballgame now. It’s all about making returns rather than for the utility of staying in the property.

On one hand, you have the Singaporean/PR who believes that property investment is a surefire way to get wealthy.

On the other, you have foreign buyers looking to move wealth out of their home country and I guess one of the easiest ways to move wealth and ensure that the wealth gets preserved is to move into real estate (Singapore is by no means unique in this regard).

It’s no wonder that I see many former students only in their 20s choosing to become property agents. After all, if one deal nets you as much income as your peers earn in a whole year, then what’s the point of getting a deskbound, 9-5 job?

Given the dynamics, I’m not sure I want to be a private property buyer in this market. You’ll need the continued flow of hot money in order to make money from property investment and we know how fast sentiment can change.

A quarter of the year is gone. May the other three-quarters be good for you.

Photo by Mikes Photos on Pexels.com

What Beat the S&P 500 Over the Past Three Decades? Doing Nothing
(Morningstar)

Let your winners run.

MAS proposes stricter standards for prospecting, marketing financial products
(The Business Times)

(The article is hidden behind a paywall)

From the gist of the article, it seems that MAS wants to propose stricter standards on how financial products are advertised. While the article refrained from explicitly identifying the kinds of businesses that currently do this, it seems that the measures are aimed at the sort of people that market financial products at roadshows or the sort that advertise products with high returns on social media without further details on the type of product or the risks involved.

The Problem With Being House Rich
(A Wealth of Common Sense)

While the post is about US homeowners, the same applies to Singaporeans. Maybe even more so given the high rate of home ownership in Singapore.

The 15HWW Permanent Portfolio Update: April 2023
(15HWW)

For those looking to emulate Mr. 15HWW, I suggest taking the following into consideration before going further.

  1. The portfolio hasn’t exactly been permanent since crypto was in the original formulation of the portfolio. Remove crypto and reevaluate the performance for a better gauge of the portfolio’s performance.
  2. Benchmark the portfolio against something that has actual risk-premia rather than the CPF SA which is essentially a risk-free long bond. This is only fair as CPF is a government-backed scheme while equities, bonds (if they aren’t government securities), and crypto obviously have a risk-premium baked in.
  3. His “permanent” portfolio carries FX risk. This isn’t an argument for or against the dollar. Once again, just pointing out that investing in Berkshire, Gold, and Crypto all carry FX risk relative to the SGD.
  4. I’m not sure why there’s been a rule change from “rebalancing” to “no rebalancing” but this essentially means that this portfolio will eventually be STI/Berkshire/Crypto-heavy. This is given the assumption that equities and crypto have a higher expected rate of return than cash/bonds/gold. I’m not saying it’s a bad thing (see first link above) but just something to be aware of.
  5. You don’t measure volatility based on drawdown. But that’s also why this portfolio can’t be benchmarked against the CPF SA (vol = 0, drawdown = 0). Just saying.

I’m not saying that this portfolio is bad or it shouldn’t be implemented. I’m not about to tell someone how to invest their money. I’m just saying that I disagree with many of the points made in the post and if you want to get an accurate sense of the actual risks or how to measure those risks present in the portfolio, then you need to consider the above points.

All in all, the permanent portfolio isn’t so permanent after all.

For some reason, the hot economic topic of the week is about the USD losing its relevance in the near future. I’ve lost count of the number of local Finfluencers on YouTube that made videos about the topic in the same week. I’m not quite sure what the trigger for this is but I guess it may have something to do with the Saudis talking about switching to accepting RMB as payments for oil.

The funny thing is most of these local guys on YouTube don’t know much about international economics and basically parrot whatever they’ve read from Bloomberg or the WSJ. I’ve heard their commentary and I’ve not heard one of them mention current account surpluses/deficits, capital controls, or the amount of trade done in USD. This is International Econ 101 which pretty much determines the likely future path of a country’s FX rate.

Remember, it’s already hard enough for geopolitical analysts, macro-, and international economists to get this right. So if you hear some Singaporean YouTuber whose usual spiel is to recommend credit cards or their armchair analysis on Tesla start talking about whether the RMB will replace the Dollar, please don’t hit “Like and Subscribe”.

Photo by Mikes Photos on Pexels.com

30 under 30-year sentences: why so many of Forbes’ young heroes face jail
(The Guardian)

The short answer is because they are young, dumb, and full of c*m.

The longer answer is that we now live in a world hyper-fixated on quick fixes and instant success. Think of all the people flaunting their success on Instagram or Tik-Tok. Even if it took them a couple of years, it’s all condensed into a 15-second reel because no one has time to even sit through a clip that’s a minute long.

And that’s going on the premise that a successful business or product can be built in a year or two. To my knowledge, that’s a lousy premise.

Oh, and it’s also telling that the list is from Forbes. That goes to show what sort of media outlet they are – one that focuses on fads and headline-grabbing personalities rather than actual business.

Weekend reading: Making a K Drama out of the FIRE movement
(Monevator)

Adding this purely for the commentary on the link between a certain K-drama and the FIRE movement. I resonate with this because if investing doesn’t lead to freedom to do whatever you want, then what the hell are you doing it for?

Sadly Giving Up On Retirement And Going Back To Work
(Financial Samurai)

Not quite what the headlines suggest.

Following the downfall of Credit Suisse, markets seem to be fearing a contagion among European banks. Deutsche Bank seems to be the poster boy for this new wave of contagion and I think news in the coming week will be all about whether the ECB manages to contain this wave of negative sentiment or whether we’ll see another wave in this banking crisis.

Early in the year, I was in the camp that the hike in interest rates could cause instability in some markets but I never thought that it would be in the banking sector given how much more capitalised banks are following the GFC. I honestly thought it would be in commercial real estate (especially the office segment) because of how work-from-home has become a fixture of post-covid life. If the banking sector is already reeling from this recent turmoil and the commercial real estate sector takes a hit, things could get ugly.

Having said all this, the next few years could be one of the rare times where DCA-ing into the market will outperform lump-sum investing. If you’re a young investor getting started today, you couldn’t pick a better time.

Photo by Mikes Photos on Pexels.com

‘Gerbil banking’ preceded the Great Depression. We’re seeing it again today
(Fortune)

Was this the genesis of the Post Office offering banking services? I’ve always wondered why Japan’s Postal service had such a huge banking arm and why we have Post Office Savings Bank (POSB) in Singapore. Maybe this origin story in the US explains it.

Strategic thinking matters
(Klement on Investing)

The game described in the article is one that I’ve read about before. In fact, they used the very same setup in one of the games in season 2 of Alice in Borderland on Netflix. Maybe it’s a good filter when hiring traders.

Why your financial conditions index sucks
(FT.com)

The money shot from the post is:

In any case, because a financial conditions index has no natural unit, it can’t really be compared over long periods – as Catherine Mann points out, there’s no absolute answer to whether conditions are “loose” or “tight”, just a sense that if the line is going up they’re getting tighter and if they’re going down they’re getting looser. This means that the FCI, however cleverly constructed, isn’t giving more information than you could get by looking at a chart of share prices (with maybe a fleeting glance at a chart of bond spreads). 

Aha, maybe it’s time to throw some of these things away.

Where People Find Meaning in Life: revised in 4 slides
(r/dataisbeautiful)

Someone posted a visualisation of a survey on areas in life that people in different countries find meanginful. I found this interesting for a few reasons:

  1. Family, Children, and Community relations rank near the top across all nationalities. This seems to echo the finding from The Good Life which is a book based on a long-running study of what matters in life to people.
  2. The results for Singapore (see 2nd picture in the link) are arguably quite different from every other country in the survey in that even in the top-ranked category “Family and Children”, only 29% of those surveyed answered positively on whether they found meaning in life from this category.

In short, maybe whatever studies you read about that survey predominantly White Anglo-Saxon People (WASPs) don’t really apply to this part of the world after all.

Photo by Murilo Botelho on Pexels.com

Following my previous posts on retirement (here and here), I’ve been thinking about how to measure how far along one is on the Financial Independence ladder. Measuring your financial fitness is also useful to gauge which areas you need to improve on. While I’m sure that this is as much an art as it is a science, it’s helpful to be able to quantify some of these measures or have some sort of benchmark to compare against.

Many others have already attempted to answer this question and I have drawn inspiration from the works of many other people who have tried to answer this question. If there are any errors in my interpretation of their work, I apologise in advance.

Some ways to measure your financial fitness

Kyith from Investment Moats has this post on what he calls the “11 stages of wealth”. It’s a linear way of measuring one’s financial fitness and I think the nice thing about this is that it’s easier for most people to think in linear terms. I’m not sure I completely agree with this way of representing things because it’s not so clear that some levels come before others. For example, level 6 states that “wealth is 10 years worth of current annual expenses” while level 7 is “wealth’s annual cash flow is greater than annual basic survival expenses”.

I’m not sure why level 7 is after level 6 and to me, one seems like a stock measure while the other is a flow measure. For non-finance people, you may think of this as one metric measuring how much water is there in a storage tank while the other measures how much water flows out of the water tank. The two measures are related but they mean very different things. For example, you could have a lot of water in the tank but if the outflow is greater than any inflows, then it’s likely you’ll run out of water sooner or later.

The point I’m trying to make is not that one metric is better than the other but rather that both metrics measure different things and I’m not certain that one must come before the other.

Seedly has a set of 8 personal finance metrics which I like. They range from measuring solvency to the proportion of non-housing assets to net worth. I’ve adapted some of these and added levels against which you can measure your progress. This is very raw but I think it’s something worth exploring and refining.

More importantly, I hope it’ll be useful in helping people figure out how far along they are in terms of financial independence or it could also be used as a measure of financial fitness (i.e. which areas of your personal finances are you stronger or weaker in)

Measuring financial fitness

Here are some metrics I think are useful and the various levels to assess one’s fitness.

LevelsSavings rate
(with CPF)
(%)
Savings rate
(w/o CPF)
(%)
Debt servicing ratioDebt to equity
(%)
Months of emergency cashNet worthLiquid assets
(% of net worth)
Income from assets
(% of current expenses)
1< mandated CPF contribution rates< 0%Unable to repay periodic payments>100Nil<0NilNil
2= mandated CPF contribution rates= 0Able to only make min. repayments to rollover debt=100< 300-150-30
3< mandated CPF contribution rates + 10%1-10Able to repay debt repayments<=60< 6>=$100K16-30>30
4< mandated CPF contribution rates + 20%20-30Monthly income > 5x monthly debt repayments<=40< 10>=$1M31-45>50
5< mandated CPF contribution rates + 30%>30Monthly income > 10x monthly debt repayments<=20> 12>=$5M>45>100
Source: Author’s own

Let me describe each measure, how it’s calculated, and why it matters.

Savings rate (with CPF) – this measures the total amount saved either through CPF or net monthly pay. While many people in Singapore use their CPF OA to pay for their monthly mortgage, this metric gives a more comprehensive picture of a person’s true savings rate since it is not true that ALL Singaporeans will use their CPF OA money for housing.

Savings rates (w/o CPF) – this measures the savings rate based on net monthly income. It indicates one’s willingness and/or ability to forgo current consumption and is a good indicator of how soon a person can reach financial independence. This is especially so since there is a cap on CPF contributions above a certain income. From the earlier piece on retirement, it appears that a savings rate of 10% is typical across the developed world, hence I’ve let 10% be the middle ground (i.e. Level 3).

Debt servicing ratio – this is a cashflow measure that determines whether one is on the road to financial ruin. After all, if one’s income is unable to (fully) service their debt, then interest on the debt will accumulate and you will either need to sell assets to raise cash or find other sources of credit to draw from.

Debt to equity – provides an indication of one’s ability to take on and service debt. In this case, equity for a person is equivalent to his/her net worth. It’s an indicator of their ability to pay off their debts. Any number above 100% means that a person is technically insolvent because the equity (assuming it’s sold instantaneously for its current value) is not even able to cover the amount of debt that one has.

Months of emergency cash – An indicator of how much cash a person has to tide through any loss of income. Depending on how conservative you want to be and assuming the typical case where income is more than expenses, you could measure this as months of expenses to cover (less conservative) or months of income to cover (more conservative).

Net worth – everyone’s favourite indicator. More often used in a dick-swinging contest but it gives a person an indication of how wealthy you are and how many goods or services you could theoretically purchase. Obviously, the higher the number, the better. I’ve used $5M as the entry point for the highest level because let’s face it, inflation has and will continue to make being a millionaire less of a deal than it used to be.

Liquid assets – an indicator of true wealth since liquid assets are also assets that are more likely to be liquidated close to their stated value at any point in time. Classification by their broad category can be misleading. For example, equities are generally thought to be liquid assets but some equities can be thinly traded and have large bid-ask spreads, making their net realisable value quite different from the current value. Markets that are liquid may also see their liquidity vanish in certain scenarios. Generally, the higher the better and it’s quite telling that as people get richer, they tend to hold a larger proportion of their net worth in financial assets (liquid) rather than real estate (less liquid).

Income from assets – An indicator of whether you still need that income from work. These include income from fixed-income instruments, dividends from equities, or rental income from real estate. Putting Dividend Irrelevance aside, many retirees and investors spend only their dividends and don’t draw down on the principal. You may argue that this is not optimal but if it works from a behavioural standpoint, then it is what it is. In general, the higher the better as this reduces the need for an income from work.

In short, the above metrics seek to measure a person’s ability to withstand financial hardship in the event of loss of income from work or to meet unexpected expenses. It also looks at whether a person has difficulty repaying debts or risks becoming bankrupt.

Where I stand on financial fitness

Savings rate
(with CPF)
(%)
Savings rate
(w/o CPF)
(%)
Debt servicing ratioDebt to equity
(%)
Months of emergency cashNet worthLiquid assets
(% of net worth)
Income from assets
(% of current expenses)
46%21%4x11%11>=$1M39%13%

As you can see, I’m at level 4 on most measures which is to say that financially, I’m in a comfortable spot. While my debt servicing ratio is at level 3 (it’s probably closer to level 4), I wouldn’t worry too much because my debt-to-equity levels are really low (level 5).

The area that I really need to work on is increasing my income from assets (level 2). This is an indication that a good proportion of my assets are non-income producing (i.e. home equity, non-dividend paying stocks/businesses, or capital gains from past investments).

I’ll be tracking these metrics on a monthly basis to see how they evolve. I don’t expect to see much change from month to month but I guess it’s like monitoring things such as blood pressure to make sure that everything’s going well.

I’m sure there are many ways to improve these metrics. Maybe we could measure net worth excluding primary residence?[1] Are there other metrics to consider? Are the various levels appropriate?

Let me know what you think in the comments below!

Notes:
[1] Although the counter-argument is that for someone who’s considering selling their house to live overseas or to rent out their house and rent overseas, including their primary residence in the calculation gives a more economically-accurate picture of their finances.

How quickly the mood has changed. The optimism that we saw in January has quickly become less positive no thanks to the strong labour market and inflation numbers. Markets are now pricing in a higher peak in the Fed Funds Rate although it seems that the market still expects rates to start coming down by next year.

Photo by Mikes Photos on Pexels.com

WRITING IS THE MOST UNDERRATED SKILL FOR WORK (cheerfulegg)

Sadly, I’m finding this out the hard work in my latest job. I endeavour to write more and hopefully, through that exercise, I’ll become a better writer in time.

Buying A Modest Home Has Been A Poor Wealth Building Advice For The Past 10 Years (15HWW)

The gist of this post is that Mr. 15HWW is experiencing FOMO.

Before I shared my thoughts, let me state upfront that my wife and I have also benefited from the run-up in property prices.

Selling our BTO flat to move into a resale HDB in a much better location has been a game-changer in terms of quality of life. We’ve managed to cut our travel time to and from work and for personal reasons, this estate works much better for us.

Selling our BTO flat also meant that a fair amount of the resale flat’s price was paid for by the buyer of our BTO flat. In a way, it’s just simply unlocking the value in home equity that would otherwise remain trapped in your home and you may be getting richer on paper as Mr. 15HWW found out but it won’t really translate into something tangible. The bonus is that the recent increase in HDB resale flat prices mean that our home equity has also increased by a six-figure amount.

At the same time, those who are feeling FOMO for missing out on the increase in property prices need to see things from a broader perspective. Most people who sold their BTO flat to buy another property would probably have taken a more expensive mortgage and have higher loan repayments. With the recent increase in home loan rates, these same buyers are probably feeling the heat so I wouldn’t be too envious of them.

From the story, it also seems that the Senior’s mortgage also keeps going up with every next property purchase. I’m not sure about others but that seems unpalatable to me. I wouldn’t like the idea of having to continually face higher monthly payments on my home loand as I age. This should be particularly true for those in their 40s who will probably see their earnings peak and encounter a higher chance of being let go in an economic downturn.

The last problem with looking at home equity as a form of wealth is that if you only have one property, your home equity is locked up in the property which is a roof over your head. To unlock that value, you have to buy and sell that property*. When you sell, you will have to move. Having moved house twice (once to my BTO, and now once more to my current place), I can safely say that I don’t enjoy the process.

Anyhow, if you see buying (and staying) in a home as part of your wealth-building process, then it is only right that you consider the growth of the total portfolio equty and not just the equity in your home. After all, monies not invested in property can and should be used to invest in other assets. If you see things that way, the gap between someone who benefited from a rise in property prices and those who haven’t shouldn’t be so huge.

*I know you can take a home equity loan if you have private property but that also comes with its associated costs and risk.

How Much is Enough to Retire Comfortably?
(A Wealth of Common Sense)

The post is commentary on a Bloomberg article which did a poll. Anyway, long story short, those polled said they need an average of $3m to retire. There are some minor differences in proportion of respondents across geographies but that’s the most common response.

$3m is real terms. If that number is truly real, then I think a good swath of the population will never be able to.

Ever since I wrote those two posts on retirement in Singapore, I’ve been seeing more opinions and views on retirement. It’s probably some psychological effect that I’m noticing more of these sort of articles but nevertheless, it’s more data to help form an opinion on this issue.

Photo by Pixabay on Pexels.com

After my previous post on this topic, I saw this video by Christopher Ng[1] where he calculates that the average Singaporean Household saves about 10% of their income (net of CPF). I thought I should run the numbers again using this savings rate and see how this changes the results.

The video also mentions how much expenses an elderly couple would expect to incur in retirement for a basic standard of living. This is based on an LKYSPP study that was done (link to Seedly feature) and it says that a single elderly person needs about $1.421 per month for a basic standard of living. However, we’re also interested in someone who wants to retire early and the seedly piece calculates the per household member figure for a basic standard of living at $1,600 per month.

The other sanity check I made was to see what nominal rates of returns a 2% inflation rate would give for the real rate of return assumptions I made previously. With a 2% inflation rate, the nominal rates of return for Equities, CPF-SA, and Cash is 7.6%, 4.6%, and 3.0% respectively. I’m quite satisfied with these nominal rates of return as they seem in line with what you could expect from each of these asset classes over the long run.

Using a 10% savings rate, the numbers are:

OptionsFinal Nest Egg (A)Final Nest Egg (B)Final Nest Egg (C)
Retire at 45$344,254.43$241,662.22$203,020.13
Retire at 55$657,563.21$369,846.34$280,756.48
Retire at 65$1,192,739.87$533,932.84$366,625.76
Note: this is a simple FV calculation given the assumptions laid out earlier.
PV = $100,000, N = 15/25/35, R = 5.5%/2.5%/1%, PMT = $4,500 x 12 x 10%

Comparing this to the numbers that assume a 20% savings rate:

OptionsFinal Nest Egg (A)Final Nest Egg (B)Final Nest Egg (C)
Retire at 45$465,261.21$338,494.62$289,943.37
Retire at 55$933,787.19$554,298.26$433,269.75
Retire at 65$1,734,097.23$830,545.16$591,591.25
Note: this is a simple FV calculation given the assumptions laid out earlier.
PV = $100,000, N = 15/25/35, R = 5.5%/2.5%/1%, PMT = $4,500 x 12 x 20%

My quick thoughts on the results of a 10% savings rate vs. a 20% savings rate are:

  1. The numbers with a 10% savings rate seem more realistic for the average Singaporean. Looking at the “(B) + retire at 65” combination, that seems like a pretty healthy sum especially if you factor in one’s CPF Life payouts.
  2. The 10% savings rate + (C) combination seems to provide unsatisfactory levels of real wealth. Using the 4% rule as a quick rule of thumb, the retire at 65 option only provides an additional $1,222 per month.[2] Combined with CPF Life payouts, that would provide someone with enough to live in Singapore but little buffer for anything else. It also assumes that this person doesn’t have a mortgage or rent to pay which may not be the case.

In short, if you choose to earn cash-like returns of 1% real returns p.a., you had better be saving much more than 10% of your income. If you earn CPF-like real returns of 2.5% p.a., saving 10% of your income is ok I guess.

On the other hand, the bad news for early retirees is that if you use the $1,600 per month figure from the LKYSPP study, our back-of-the-envelope calculation using the 4% rule says that you’ll need at least $480,000 in your nest egg (remember, you can’t depend on CPF Life if you’re retired early.) in order to generate that $1,600 per month.

You’ll see that even in our “Save 20% of your income + Invest in the markets” scenario, you won’t quite get to $480,000. Therefore, if you really want to retire early, you’re going to have to save much more than that and/or earn much higher rates of return. The danger in reaching for yield, of course, is that you blow your account up as many people invested in crypto found out last year.

In a future post, I’ll explore more on why $480,000 isn’t quite enough for early retirees in Singapore.

Notes:
[1] Christopher Ng writes at Growing Your Tree of Prosperity. I follow his work and it is always well-researched and well-written. Even the snarky posts.

[2] You may quibble with the use of the 4% rule as I have (link here) but I would think that for our purpose here, we can afford to be roughly right.

Photo by Pixabay on Pexels.com

[Updated 7:51pm, 6 Feb 2022: There was a mistake in the calculations (classic spreadsheet error!) for scenarios (B) and (C) in the earlier version of this post. I have fixed the mistake. Many thanks to the reader who alerted me to it.]

I shared some brief thoughts on Kyith from Investment Moat’s post (Should You Retire at 30 Years Old with $1 Million or Retire at 40 Years Old with $10 Million (As a Singaporean)?) and that got me thinking about the likely choices an average Singaporean would face when thinking about working longer or retiring early.

If you read my earlier thoughts, I thought that the $1m vs. $10m tradeoff is something that hardly any working Singaporean would face. The next natural question was: What choices would an average Singaporean face?

Assumptions

To model the average Singaporean, I will assume the following:

  • Earns a median monthly income (excluding CPF contributions) of $4,500 (source)
  • Saves 20% of their income
  • Starting capital of $100,000
  • Starting age of 30 years old

I’m fairly confident the first assumption makes sense. That amount is the median income earned by an employed resident (i.e. Singaporean or Permanent Resident (PR)) and therefore is representative of the average Singaporean. Furthermore, I have assumed a starting age of 30 years old for this hypothetical Singaporean so no one can quibble that fresh graduates won’t be earning the median income.

I believe the $100,000 starting capital assumption is not a far-fetched one. It may be a stretch for some but given how the $100K by 30 stretch goal has become popular in recent years, I believe this is also doable.

The second assumption is a little more tricky. I thought of using the Personal Savings Rate (PSR) that is officially calculated by Singstat. Dollars and Sense has an article that calculated the long-term average as 30.7%. However, if you look at Singstat’s definition of the Personal Savings Rate, you’ll realise that it depends on Personal Disposable Income (PDI) which really is more of a macro variable tracking the income of the household sector rather than the actual savings rate of the average household.

The PDI includes Contributions from Employees (which probably includes CPF) and Operating Surplus from charity and religious organisations. The latter distorts the PDI upwards and definitely doesn’t reflect the income of households. More importantly, I couldn’t find out whether the Contributions from Employees include CPF contributions or not but I believe it does. That would change the analysis quite a bit as CPF monies are typically used for housing and not investment. This would mean that the PSR isn’t a good proxy for calculating the actual cash savings that could be used for investments.

To make things simple, I decided to use a savings rate of 20% and the median income (after CPF contributions). This then assumes that my average Singaporean saves 20% of their monthly income net of CPF contributions. Whether this is too high or too low is up for debate but I use 20% since the 20% savings rate is part of the popular 50-30-20 budgeting rule.

I’ll check around informally with my friends if this makes sense but for now, I will assume that it does.

I then calculated the ending portfolio value for three options (work until 45 vs. 55 vs. 65) under three different rate of return scenarios (1% p.a. vs. 2.5% p.a. vs. 5.5% p.a.). I’ll explain why I chose those rates of return.

Rates of Return

I looked at three rates of return scenarios – (A) 5.5% pa., (B) 2.5% p.a., and (C) 1% p.a

All three rates of return are real rates of return which means that I assume these are adjusted for inflation. For the sake of simple calculation, I also assume that wages increase at the same rate as inflation. This makes the calculation and interpretation easy as it means that any comparison between the numbers for retiring at 45 vs. 55 vs. 65 are ones that only concern purchasing power.

For example, this means that the decision to retire early at 45 with $100,000 vs, the decision to retire at 55 with $200,000 is really a question of whether one should give up $100,000 of purchasing power or work for another 10 years.

(A) 5.5% p.a.

I chose this rate of return to illustrate the CAGR of savings invested completely in a portfolio of diversified index funds. A 5.5% real rate of return with an assumed 2% p.a. rate of inflation gets us a 7.5% p.a. nominal rate of return for equities.

I think this is reasonable since the 10-year yield on US government bonds is about 3.5%. Add to that an equity risk premium of 4% and that brings us to exactly 7.5%.

(B) 2.5% p.a.

This rate is meant to reflect the rate of return one could get from the CPF SA/MA. As every Singaporean knows, the CPF Special Account (SA) and Medical Account (MA) pay 4% p.a. (slightly more since there is an extra 1% paid on the first $60K in Ordinary Account (OA) SA.) but I’ve just given this a real rate of return of 2.5% p.a. to reflect the slightly better than the cash rate.

(C) 1% p.a.

This is meant to represent the cash/short-term bills rate. I know cash has been earning next to nothing or even negative returns but this assumes that this form of savings/investment will earn its long-term rate of return. Basically, something to conserve/minimally increase purchasing power over time.

Findings

OptionsFinal Nest Egg (A)Final Nest Egg (B)Final Nest Egg (C)
Retire at 45$465,261.21$338,494.62$289,943.37
Retire at 55$933,787.19$554,298.26$433,269.75
Retire at 65$1,734,097.23$830,545.16$591,591.25
Note: this is a simple FV calculation given the assumptions laid out earlier.
PV = $100,000, N = 15/25/35, R = 5.5%/2.5%/1%, PMT = $4,500 x 12 x 20%

My takeaway from the table is:

(1) If you earn a low rate of return on your savings (B and C), an extra 10 years of work hardly does anything for your wealth. Someone who works an additional 10 years is only 17.7%-34.3% (in scenarios C and B respectively) better off in terms of real wealth.

(1) If you earn a low rate of return on your savings (B and C), an extra 10 or 20 years of work makes you anywhere from 0.5-2.5 times better off in purchasing power. I imagine this could be the difference between remaining in the middle class vs. moving into the upper-middle class.

(2) If you earn a higher rate of return (e.g. (A)), that equation changes drastically because you are looking at anywhere between 2-3.7 times more in terms of purchasing power. That is a huge tradeoff but still nowhere near the ten times difference in ten years that was assumed in Kyith’s post.

(3) In (A), the early retirement scenario (first row) gets the average Singaporean a decent nest egg of almost half a million Singapore dollars. This also excludes the amount in his/her CPF account which will either be in cash or in the form of property. By the standards of almost anyone else in the world, this is a lot of money.

Based on the calculations above, it appears that in all scenarios, the average Singaporean could be very well off in retirement. Retiring with $591,000-$830,000 at 65 years of age is quite good by global standards so why is it that many Singaporeans still worry about not being able to retire?

Is it because many Singaporeans don’t save anything beyond the forced contributions to CPF? After all, contributions to CPF make up roughly 20% of their income so to expect the average Singaporean to save another 20% of the remainder seems like a tall order. And if many Singaporeans use their CPF monies (mostly) for housing and that amount grows at the same rate as in Scenario B, then it could mean that many Singaporeans reach the level of wealth in the table above but the problem is that wealth remains locked in their homes.

To conclude

I’m pretty sure that many people will quibble with the assumptions or numbers that I’ve used. For example, some people earning the median monthly income may say that it’s impossible to save 20% of their income. That could very well be true if you are the sole breadwinner for a family of three or four.

On the other hand, I’m sure that there will be some in the Singapore Finlit space who think that the numbers presented are too low since there seem to be finfluencers in Singapore who are aiming for a million dollars by age 35 or 40. These guys probably have incredibly high savings rates (way higher than the 20% used here) and/or have experienced rates of return much higher that the 5.5% p.a. real rate that I’ve used here.

At the end of the day, retiring early or not is a very personal decision. What I’ve shown here is that given more realistic assumptions of the various real rates of return, the cost-benefit analysis comes down to more of whether you should claim your time back or spend it to be able to buy more stuff in the future.

What I hope my post gives is a more realistic expectation of the kind of wealth the average Singaporean should be able to accumulate. This will also provide a better idea of the trade-off involved between retiring early or working for a little longer.

Also, I’m curious. Are my calculations for the levels of real wealth achievable by the average Singaporean realistic? Let me know if the comments below.

Been hell of a week on the personal front.

Photo by Mikes Photos on Pexels.com

Huat ah! How I made $80,000 during the Chinese New Year holidays.
(Growing your tree of prosperity)

Christopher Ng makes some very good points in this post. I’m not sure if the point on EC still applies to the current generation. The problem I have with treating your primary residence as an investment is the fact that you will need to monetise it at some point – if you love staying there, you will be reluctant to cash out; if you only love it as an investment, it will be several years of tolerance before you cash out. Either option doesn’t sound appealing to me.

Wait for it
(The Reformed Broker)

Some good points but I don’t think this round is anywhere like the dot com bubble.

STUDY SHEDS LIGHT ON COGNITIVE DISSONANCE IN ACTIVE MANAGEMENT (TEBI)

It says something when the cook doesn’t even eat their own cooking. Having said that, we need active managers per the Grossman-Stiglitz paradox.

Photo by Engin Akyurt on Pexels.com

It’s that time once more to look back on what has passed and to look ahead at what’s to come. 2022 has been a year of huge change not just for markets but for me on a personal level. I hope this post doesn’t turn into an incessant ramble. If it does, I apologise in advance.

Goodbye Bull, Hello Bear

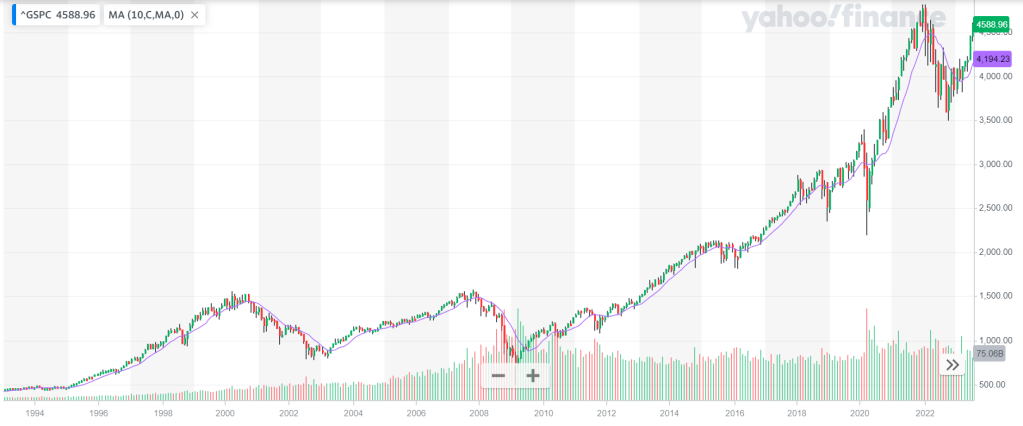
The first obvious thing that happened this year is that markets turned from being great for all the bulls to the first real bear for many Gen Z investors. The S&P 500 peaked in December 2021 at around 4800 and has been on a downtrend ever since. For Gen Zs who were mainly invested (or should I say speculating?) in pseudo-tech (please don’t be in the camp that thinks, Tesla, Peleton, or Doordash are tech stocks), meme stocks, crypto, or TSLA, the pain is particularly acute. The Nasdaq composite peaked in November 2021 and is roughly down about 30% since then. Growth-at-all-cost stocks are down even more. Using ARKK as a proxy, these sorts of names peaked in early 2021 and are now down roughly 70% or so.

This is what I said about ARK Invest in March 2021 and I guess 2022 is when I take my victory lap

So rates have started rising and “markets” are spooked. I say “markets” because honestly it’s mainly in the high flying names of last year (e.g. TSLA, the ARK ETFs etc.) that have been hit. But honestly, even if those names get hit for a total drawdown of 50%, it’s going to be hard to say if it’s cheap to buy.

Best Things I’ve Read All Week (7 March 2021)

The main cause of mayhem in the markets was the series of Fed rate hikes that started in late 2021. Since then, the Fed Funds Rate has been hiked to around 4.5% (upper bound) and the Fed’s own expectation is that they will stop hiking when the rate reaches about 5%. It wasn’t so much about how much the Fed hiked rates but also how quickly they did so. At the same time, the Fed has also begun reducing its balance sheet which is adding to another source of tightening in the monetary system.

Where the Fed hikes rate to is now a foregone conclusion. The question on everyone’s minds is how long will they stay there?

The obvious impact on markets is the sort of thing you learn in a finance 101 class. As the risk-free rate increases, so does the discount rate on future cashflows for all sorts of investments and projects. This reduces the present value of future cash flows and has a greater impact on cashflows that are more distant in the future.

This basically explains why the broader markets have fallen anywhere from 20-30%. As to whether markets will fall some more or stage a sustained rebound from here, it really all depends on whether the economy achieves that so-called soft landing that Fed is hoping for. Therefore, 2023 will be all about how bad the economy gets – will growth and employment slow down drastically, or will many companies crash, burn, and therefore cause mass layoffs to become a feature that extends beyond the tech sector?

Crypto is tested

This will also go down as the year when Crypto, as an asset class, has its Global Financial Crisis moment.

From the failure of Luna and Terra, Three Arrows Capital to Celsius and of course, FTX. This will be the year that investors in crypto realise that no matter how much they hide behind the technology, the problems that they face in crypto as an asset class are pretty much the same problems that have existed in finance forever.

Alongside the failures of those companies, their high-profile founders Do Kwon, Zhu Su, Alex Mashinsky, and SBF have not basically been outed as either frauds or really bad businesspeople. The funny thing is, in finance, fraud is a feature of every hot new thing, not a bug.

Personally, I don’t think crypto is going away but this year has made it much harder for crypto as a mainstay asset class for mainstream investors. However, if you’re still bullish on crypto, you also have to recognise that after this year, you will live with more regulation or less liquidity. Neither of which makes for the sort of rocketship-like gains unless you can time the bottom.

Revenge of Inflation

For the first time in a generation, inflation is once again a thing.

First, a mea culpa. In October 2021, I commented on a Today piece that was done on inflation.

“I’m not sure much of the inflation we’re seeing today is because of an increase in the money supply. Furthermore, isn’t the velocity of money being a bigger factor for inflation the more commonly accepted theory these days? Increases in money supply leading to inflation seem to be a very 70s thing.”

Best Things I’ve Read All Week (31 Oct ’21)

As we now know, inflation came back in a big way. However, this wasn’t completely due to loose monetary policy but also in part due to the fiscal handouts to alleviate the damage caused by Covid and the war in Ukraine. The good news is that inflation seems to have peaked but the bad news is that many market watchers seem to think that it won’t come down to the Fed’s target of 2% that soon (for example, see Howard Marks’ latest memo “Sea Change“). This seems to be the likely conclusion given the tensions between the US and China that have led to onshoring or friend-shoring of supply chains and the other ongoing geopolitical tensions around the globe.

The good news for retail investors is that something always can be done. One, yields on cash or near-cash instruments have increased dramatically. In Singapore, this caused T-bills to be a thing, and bank are now offering interest rates on savings accounts that are higher than even the CPF SA. This is a sharp reversal of the pattern seen over the past decade or more where the CPF SA’s yield of up to 5% was seen as an acceptable bargain for keeping your money locked up until you reach the age where you’re allowed to then withdraw the monies from your CPF.

The question on everyone’s mind now is: how long will this last? I don’t profess to know but the consensus seems to be along the lines outlined above.

Working in finance

This year, I left the organisation and job that I had been doing for the past 10 and a half years. It wasn’t an easy decision given how comfortable I was in the role and I’m nearing the age where you don’t really start learning new tricks. Most people my age would have gained some level of mastery in their professional life and would be close to or entering the peak earnings phase of their careers. In my case, I was due to take over from my boss so in fact, career progression is something that was on the cards.

If that’s the case, then why leave?

The reason is that I couldn’t see myself doing my boss’s role or my current role for the rest of my life. I had also become jaded with certain aspects of the job and I guess that given my age, if I didn’t try to move now, then it would be never.

At the same time, I didn’t want to leave my job just because there was some dissatisfaction with it. The work environment and the colleagues whom I worked with were (mostly) good. So it was by some stroke of good fortune that I was offered a role that involved investments.

I’m two months into the job and frankly, I’m not sure how good I’ll be at this. What I can say is that I’m grateful for the opportunity to experience and learn what an investment professional does on a day-to-day basis.

Portfolio

This year has been an exceptionally brutal one for portfolios. While the drop in equity and bond prices hasn’t been particularly bad, the problem is that both major asset classes fell by double digits. This means that what is traditionally considered a diversified portfolio (e.g. a 60/40 stock, bond portfolio) has taken a hit when investors typically expect bonds to buffer against falls in stock prices. In short, bonds didn’t deliver the protection it’s supposed to have against a fall in equities.

Fortunately for me, I’ve been accumulating cash all through the year. The other fortunate thing is that I never participated in the mania in US markets so while my existing positions accumulated over the years took a slight hit from an increase in discount rates, this was relatively small compared to the buffer provided by a sizable cash position and large holdings in the STI.

In a year where the S&P 500 is down almost 20% and the STI is down 4.61% (before dividends), my portfolio[1] is only down 2.84% (without dividends) and 1.27% (with dividends). All in all, I would say it’s roughly in line with the total returns of the STI. More importantly, the numbers presented are investing returns which is just an indicator of my (lack of) skill in investing.

A layperson would probably care more about the size of the portfolio and this would include all monies added to the pot. I made a tremendous effort to accumulate more cash in the portfolio and I don’t know how I did it but this year will go down on record as the year where I managed to add around 30% of my take-home pay to the portfolio. This helped to increase the total size of the portfolio by 7.39%.

Which would you rather have? A -1.27% returns on investment or a +7.39% increase in your portfolio size because you deferred some present consumption?

This marks my 15th year in the markets. I guess with this current cycle, you could say I’ve lived through 3 major bears now (’08-09, ’20, ’22-?).

I can’t say if the next decade will be like the last one or if will it become a secular bear that goes sideways for a while but I know that my portfolio has increased from a tiny 5-figure portfolio to a more than respectable 6-figure one.

And this isn’t because I’m some investing genius. In fact, if I was more aggressively invested, it would be a 7-figure portfolio by now. The secret is that I simply saved money, added to the portfolio, and didn’t trade in and out of positions. Based on pure investment returns, my portfolio has grown 1.93x over the last 11 years while the actual portfolio size (including cash added) has grown 5.89x. Roughly speaking, investment returns were 6.16% p.a. while total portfolio size returns were 17.49% p.a.

My experience just shows that if you’re a young investor with little capital, the best thing you can do for yourself is to continue saving, investing, and letting the gains compound. For example, adding $10,000 per year to a $100,000 portfolio increases its size by 10% while adding the same amount to a million-dollar portfolio only increases it by 1%. When your portfolio is smaller, it’s far easier to negate bad returns simply by adding more cash.

As demonstrated, adding cash does little to move the needle on a bigger-sized portfolio but I will argue that for the vast majority of people, this won’t apply. After all, how many people reading this (both in Singapore and abroad) already have millions of dollars in their portfolios?

If you want gains, just do consistent work.

[1] My portfolio only includes stocks and cash that are in my investment accounts. I don’t include cash reserved for everyday spending, monies in my CPF account, or home equity.

Life

Finally, my personal life has been great. Despite catching covid sometime during Jul/Aug, my wife and I have been relatively healthy. I’m really thankful for my wife. We lead a relatively simple life compared to many of our peers – we watch way too many K-dramas, take walks along the park near our place, spoil our cats, and the most difficult decisions we have tend to revolve around where we should go to dinner.

Compared to many folks, we have been very fortunate.

We’ve also welcomed a long-tailed black friend that we saved from my parents’ place. And after we picked him up, we started seeing many signs that he was meant to come into our lives. Maybe it’s just confirmation bias or maybe it’s fate. Who knows?

Finally, looking forward

Following a brutal 2022 that has removed a lot of the excesses in financial markets, I am getting optimistic that investing steadily and consistently over the next 3-5 years in a broadly diversified portfolio will pay off in the longer run.

This year, I’m hoping to write more on financial literacy. I think it’s a topic that, despite the government’s best intentions[2], helps people lead better lives. Too many people fall into one of two categories. They either (a) fall prey to scams, frauds, or just bad financial advice or (b) become too afraid and conservative that the value of their savings erodes over time due to inflation.

Both categories of people are pitiful but at least for those who fall in (a), you could put it down to greed. For those who fall into category (b), it’s sad because it sounds like they are doing everything right – working and saving, only to end up finding it difficult to retire or they can only do so with some form of work, or end up feeling insecure about their finances without a job.

The good news is that this isn’t rocket science and so I hope to share what I know and combine that with a real-time case study of my own path to retirement.

I wish you all the best for 2023.

[2] I say this for a fact because at my previous job, some direction came at the top level for our students to complete some compulsory modules on financial literacy. I can’t say how successful these have been because I still witnessed many of my former students fall prey to the scams, frauds, and mania that surrounded Crypto, meme stocks, and NFTs. This just shows how difficult it is for you to learn something in class and then be aware enough of how it applies in the real world when the world is going crazy about something.